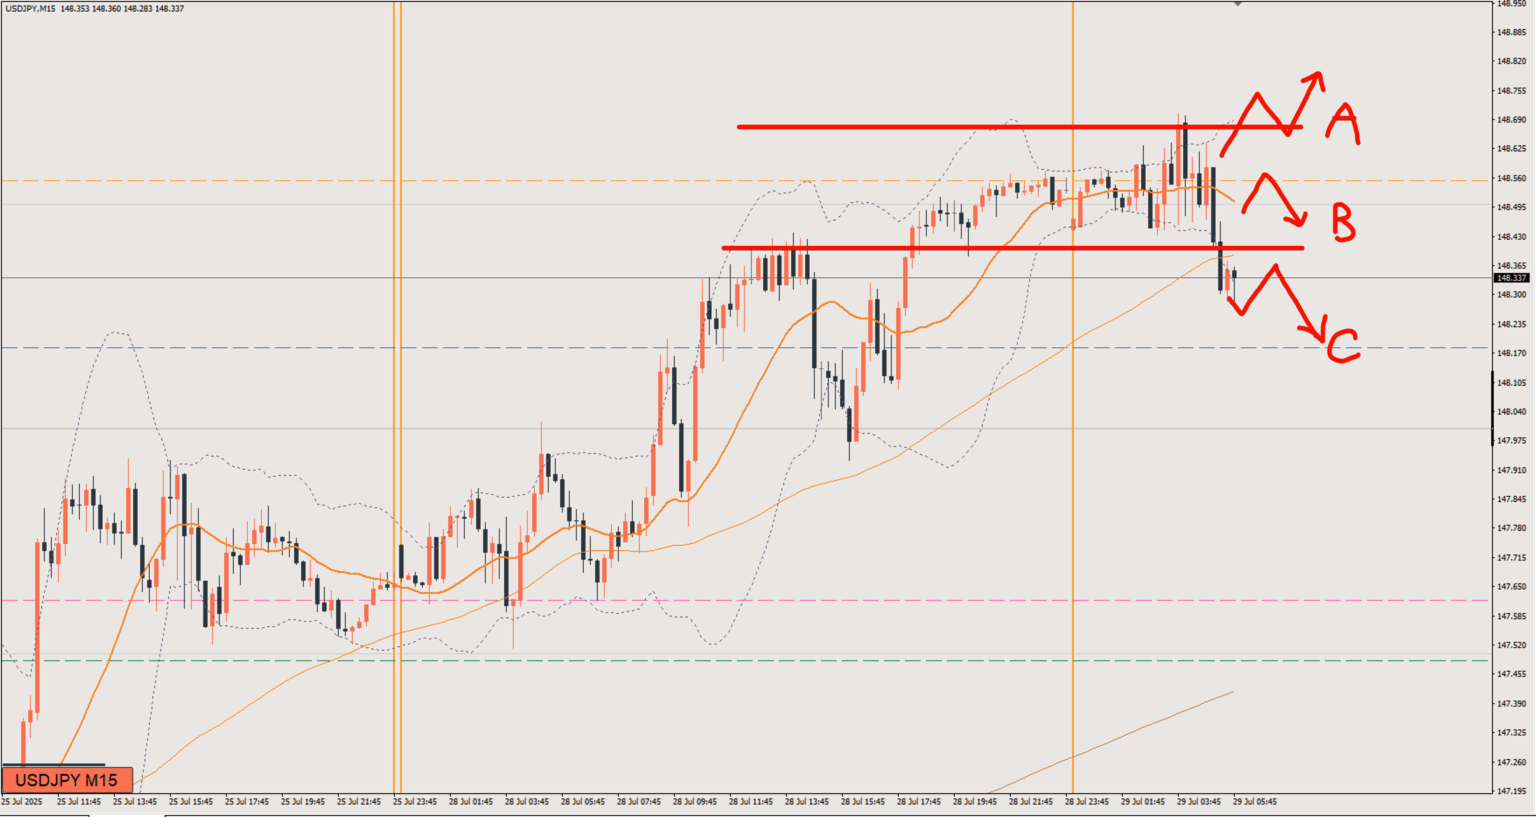
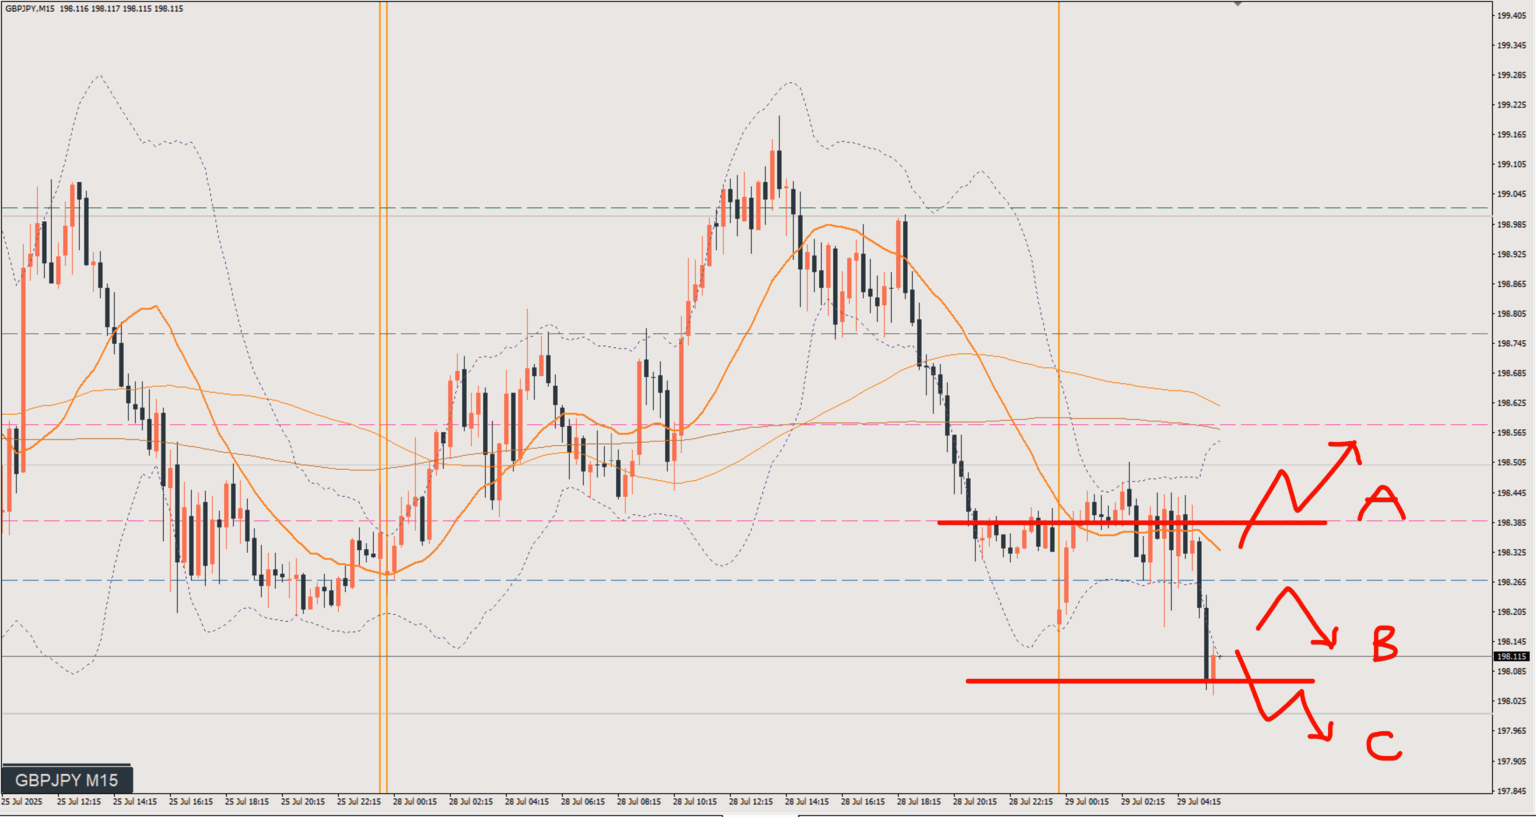
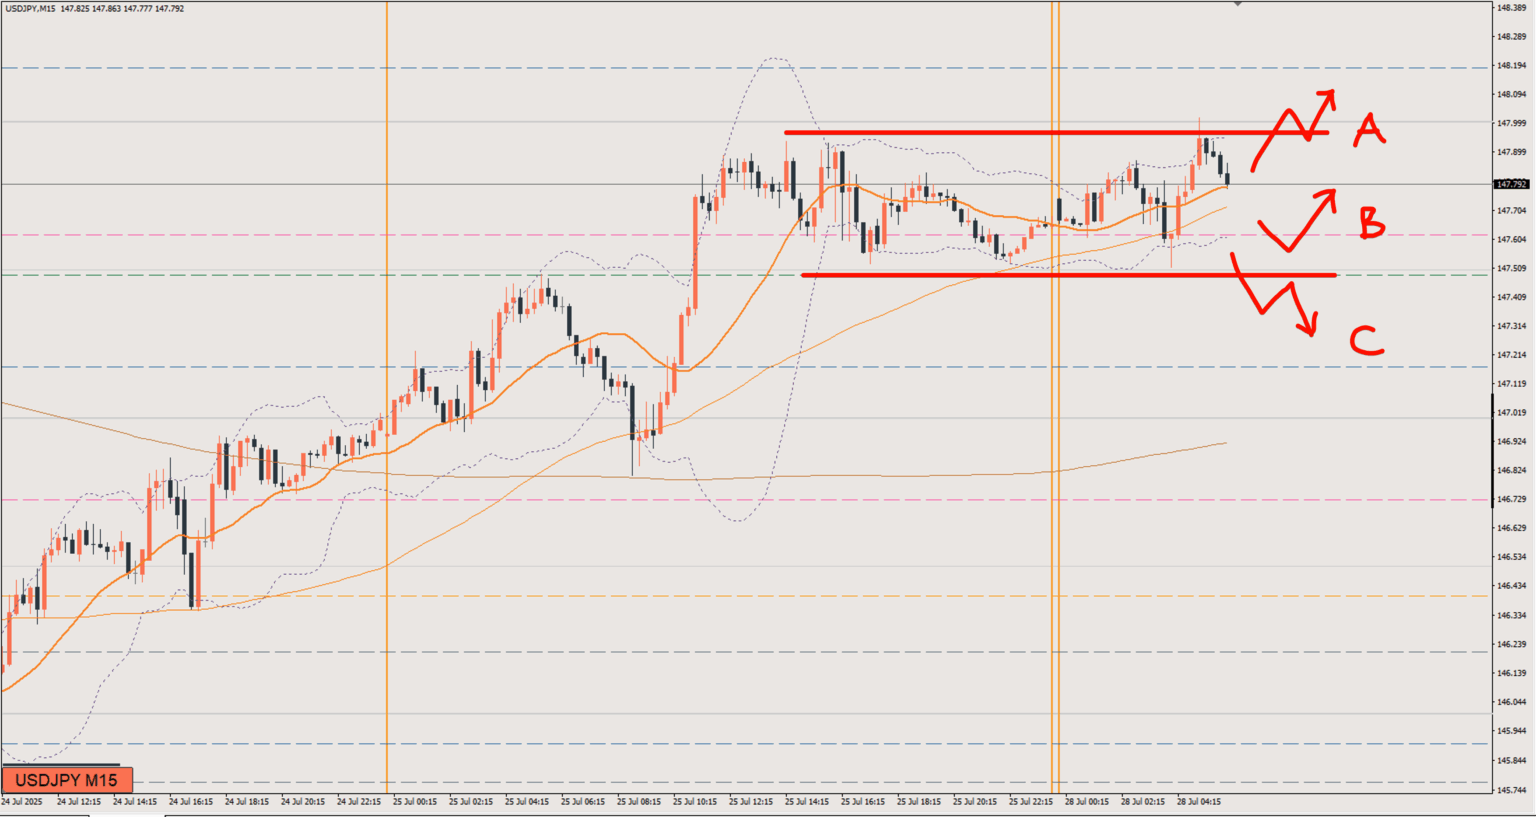
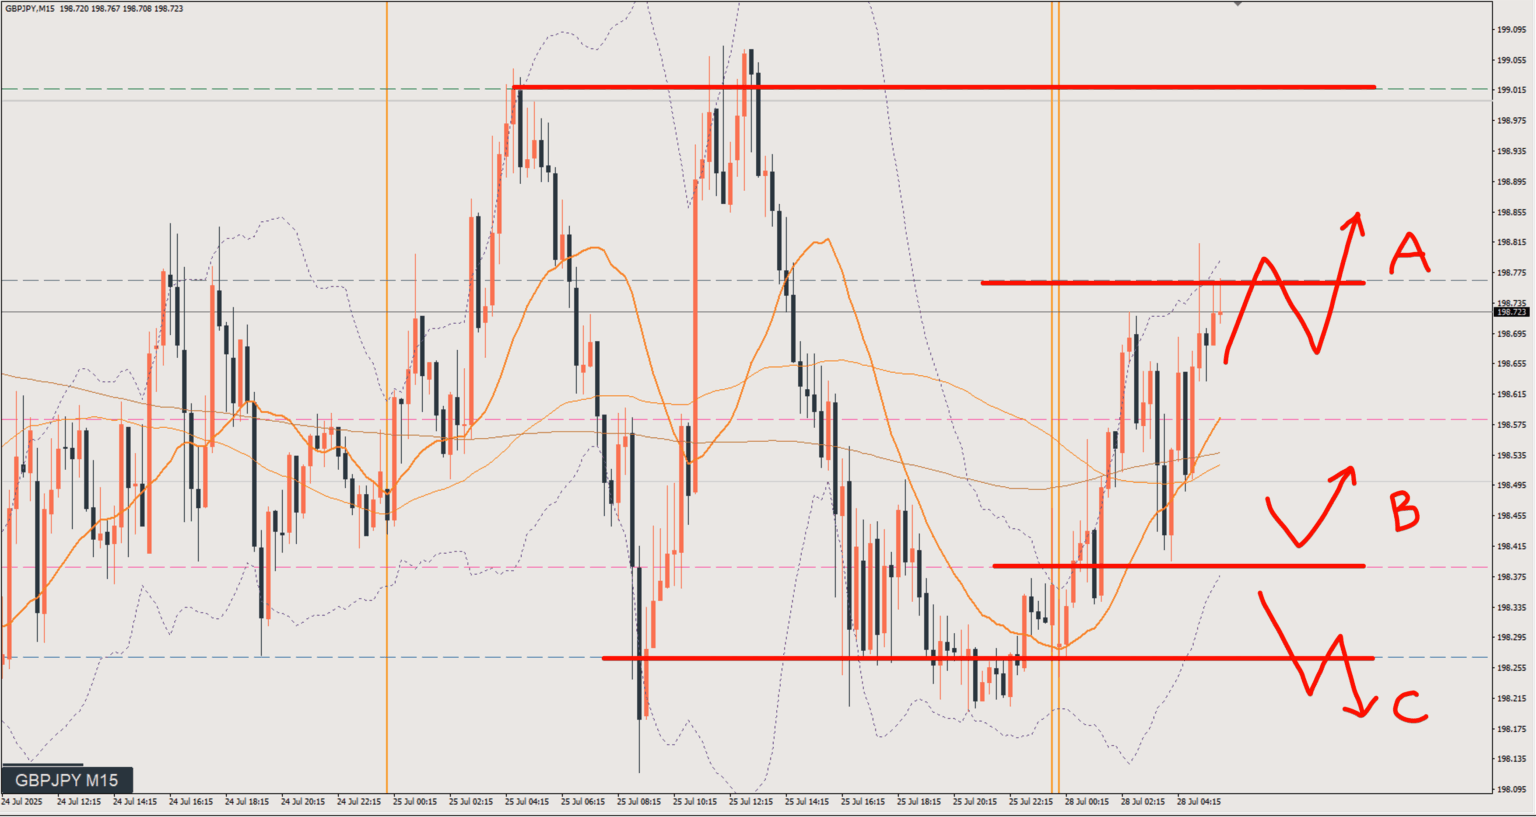
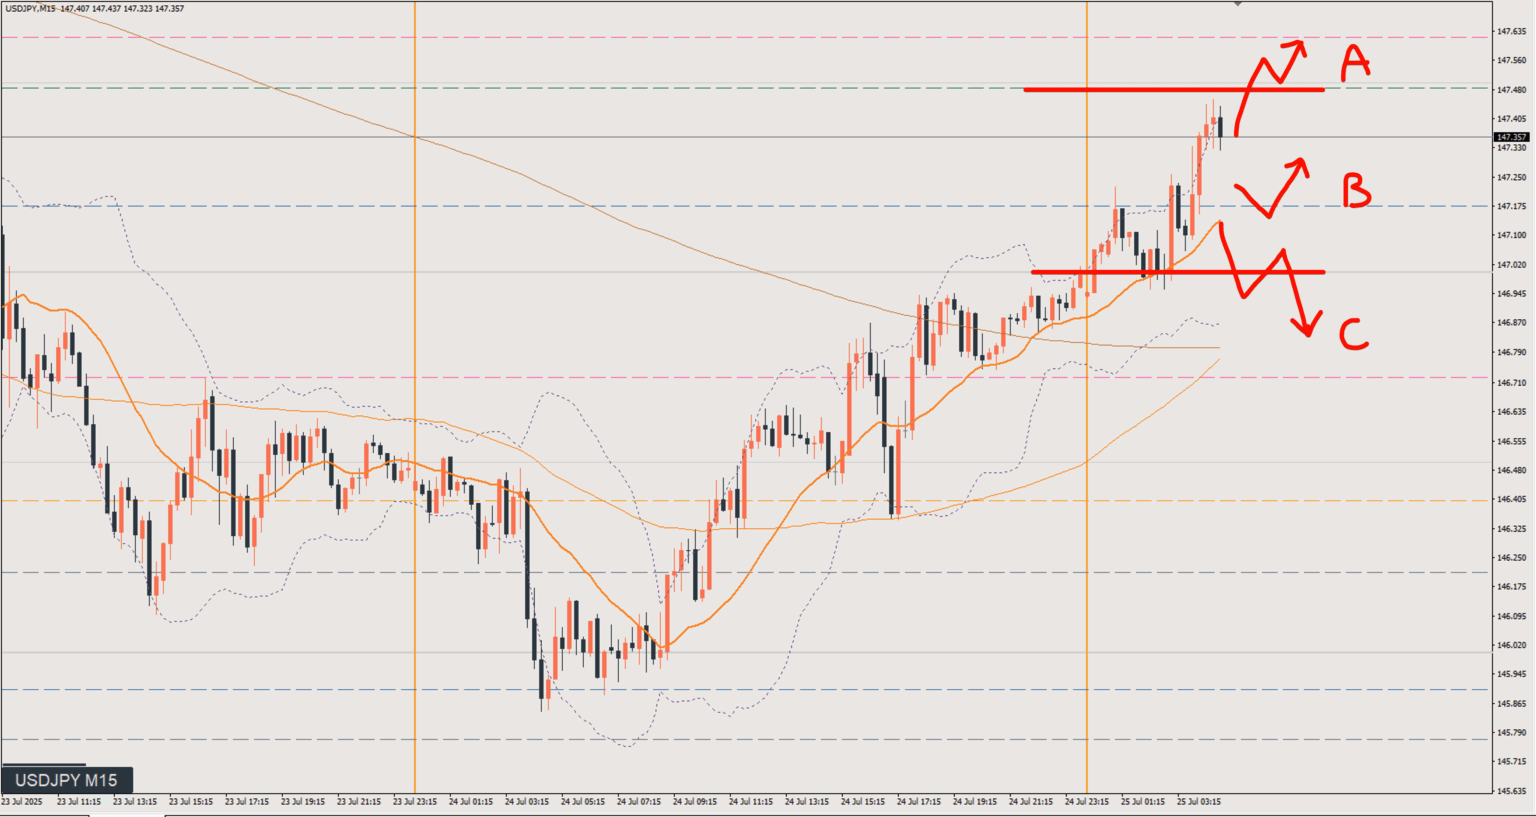
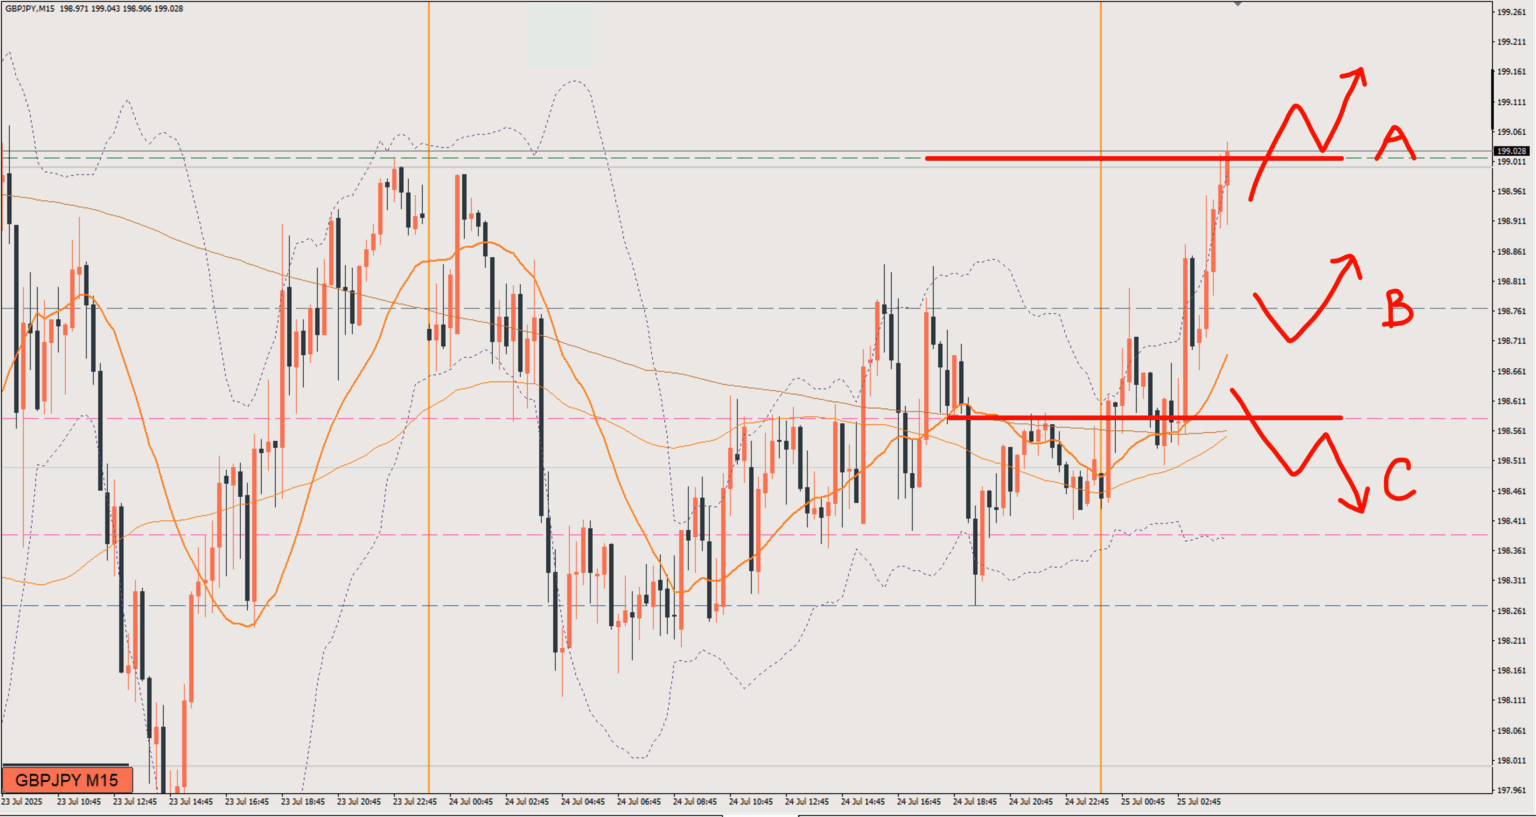
Estimated pips are the pips that would have been gained by trading ideally along the published scenario.
Currency pair
Total pips
Posts
Average pips
GBP/JPY
+751.0 PIPS
23
32.7 PIPS
USD/JPY
+647.0 PIPS
23
28.1 PIPS
Total
+1,398.0 PIPS
USD/JPYUSD/JPY
Buy
Buy targetーーー
Sell targetーーー
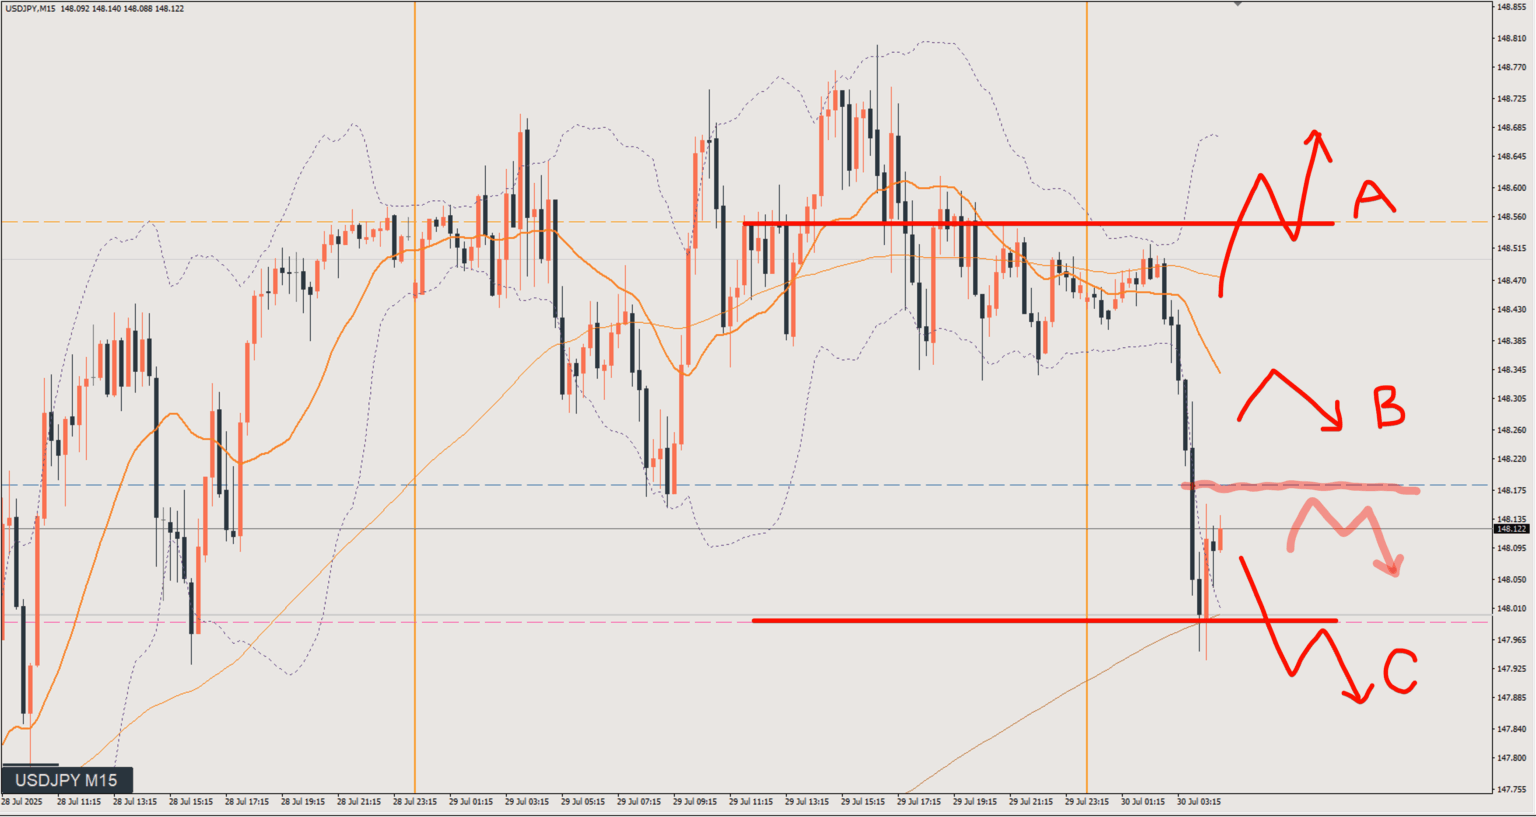
Price has been dropping in the short term, so this is a spot where you could go after the move down to 148.7.That said, the overall trend is up, so I think it's better to wait for downside stalling and look for a long.
I'm expecting price to move within the same range as yesterday.It's been ranging for days now, with the upside capped quite a bit, so maybe it's about time it broke to the downside?
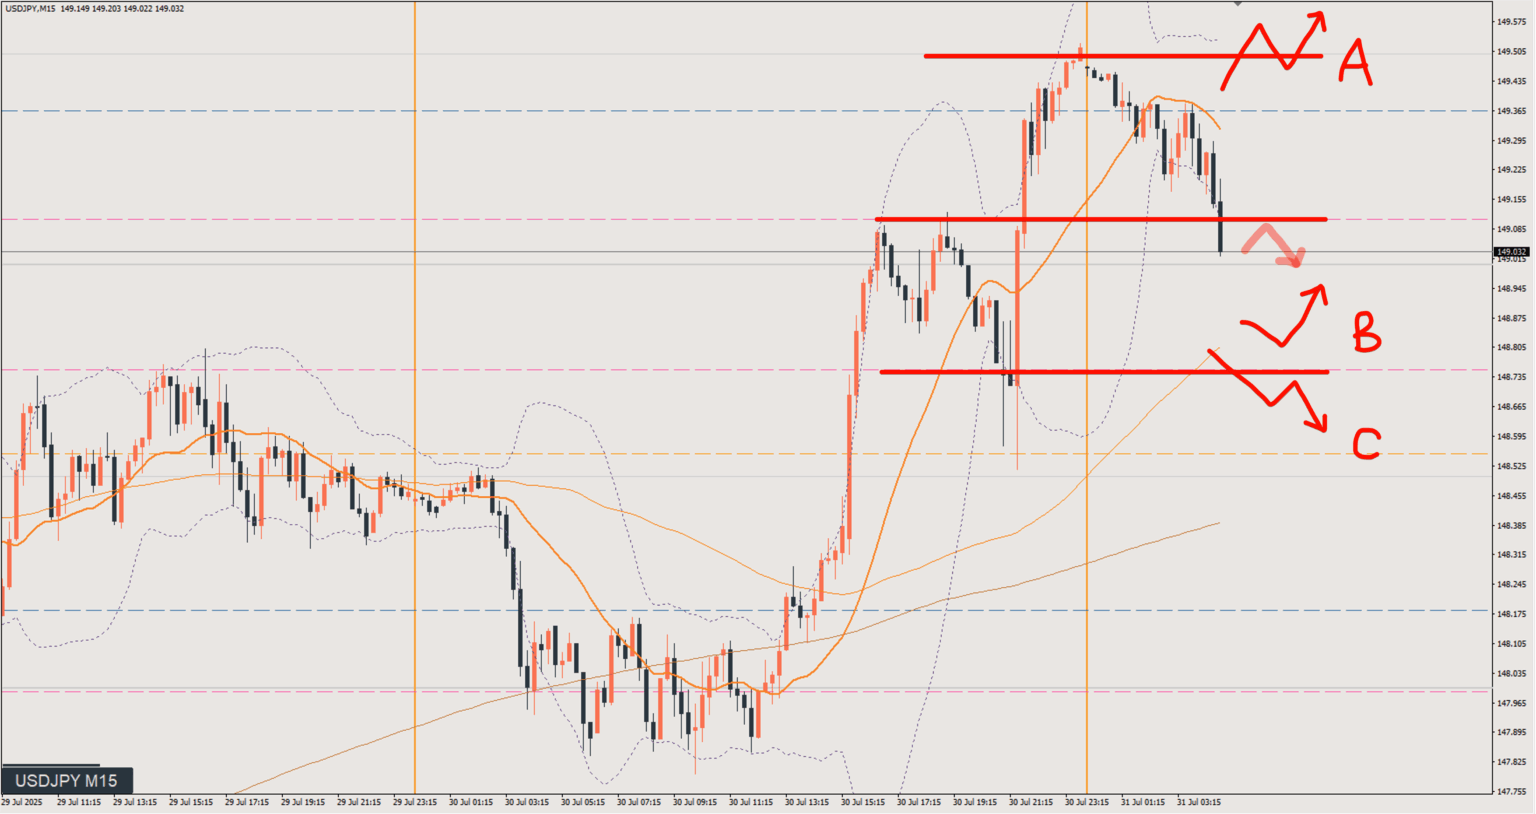
Price has broken below the blue line, but it's still a range.I'm waiting for a retracement, so this is the time to see where the short-term rise stalls.
Still in a range. The textbook play is to wait for a retracement and sell from the top of the range.If price breaks below, be careful: the yellow line just underneath is support.
Price has reached a key level on the weekly chart and looks like it's about to form a double top on the daily chart.At the day-trading level, I already see this as a bearish shift.
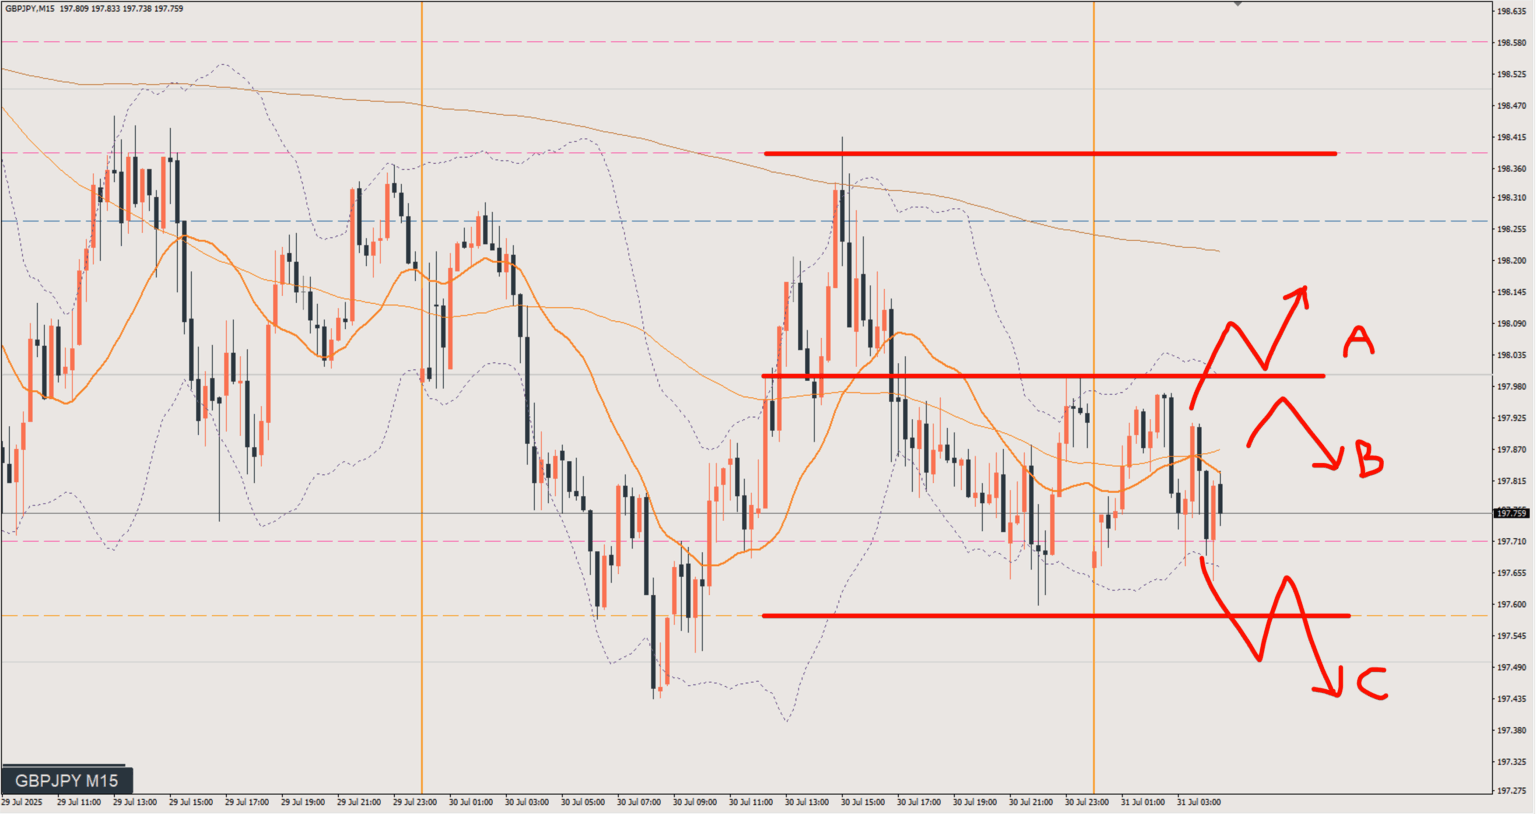
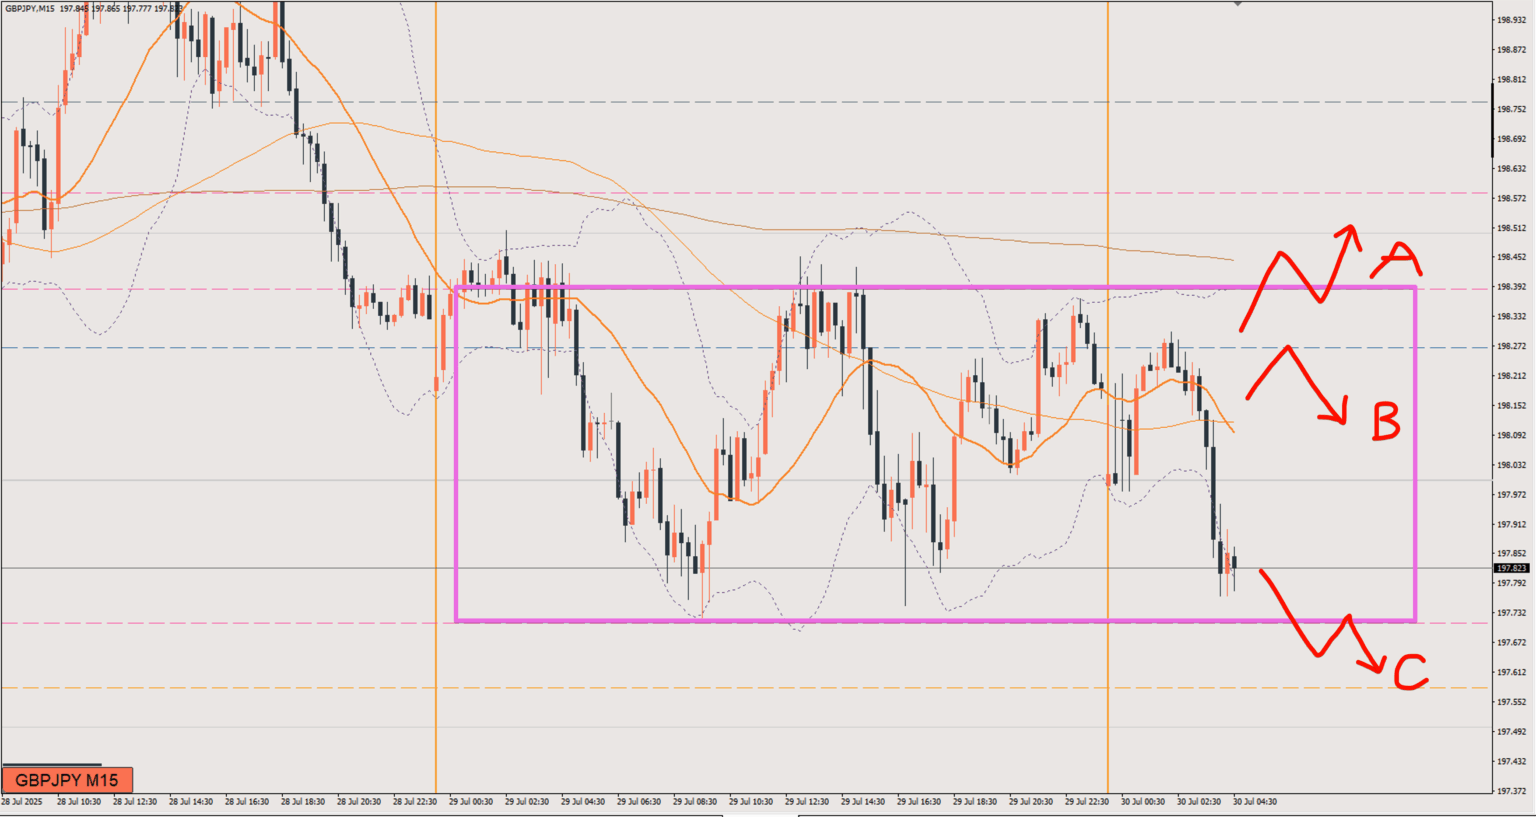
Still ranging. On the bigger picture, price is moving in a 197.6–199.8 range.It's better to either trade from the edges of the range or look at other currencies.For day trading, I'm currently on the sell side.
I'm still expecting price to move within the 198.2–199 range.Within that range, price is currently rising from the range low, so I'm looking to go long on a pullback.
Price has started rising again from the pullback low on the daily chart.The 4-hour chart (H4) also looks like it has turned to a buy, but this is still an area where selling could come in.
The current price zone is right where resistance sits, and a break above it would turn the 4-hour chart (H4) bullish as well.For now, it's a matter of waiting to see whether price breaks through or forms another pullback.