Horizontal Levels – Identifying the Market’s “Walls”
As you keep trading FX, you will notice that price tends to bounce off certain levels or struggle to break through them. A “horizontal level” is a way of visualizing these “wall”-like price zones. Used properly, they help you set entry points, take profit and stop loss levels effectively. In this post, we take a detailed look at horizontal levels, one of the foundations of technical analysis.
What Is a Horizontal Level?
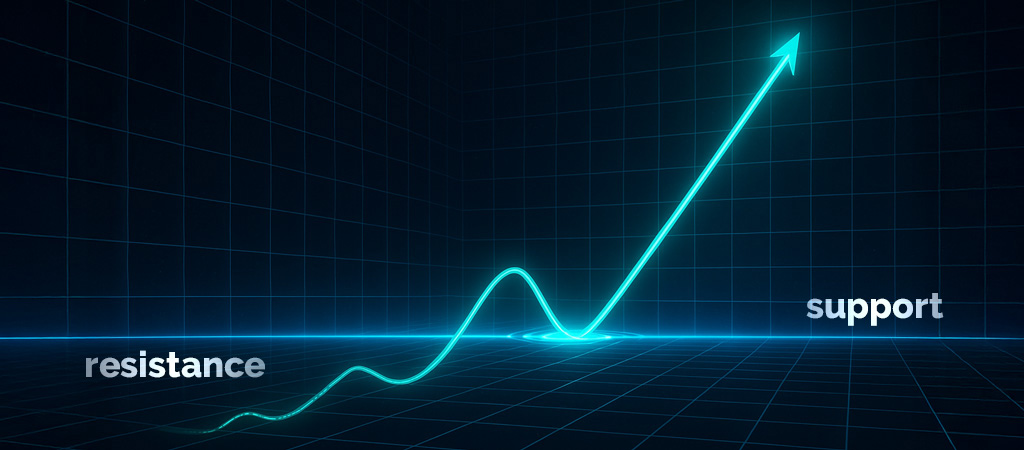
A horizontal level is a line drawn horizontally on a chart to mark a price zone the market considered important in the past. The price zones where these horizontal lines are drawn often act as resistance or support in the future.
What Is Resistance?
Resistance is a “ceiling”-like price level that price finds hard to break through as it rises. When price reaches this level, selling pressure increases, and the rise stalls or reverses.
Simply put, it represents a price zone where “price struggles to go any higher.”
What Is Support?
Support is a “floor”-like price level that price finds hard to break through as it falls. As price approaches this level, buying pressure increases, and the decline stalls or bounces.
In other words, it is a price zone where “price struggles to go any lower.”
Why Do Horizontal Levels Matter?
The reason horizontal levels matter is closely tied to the psychology and behavior patterns of market participants.
1. Important Past Price Zones and Market Memory
Price zones where the market reacted strongly in the past, such as highs and lows based on Dow Theory or the neckline of a double top or bottom, stay in participants’ memory. For example, if price bounced at 120.00 yen after a move toward a stronger yen, many traders will think “it might bounce again” when price approaches 120.00 yen once more.
2. Concentration of Orders
Many traders’ limit orders and stop orders tend to cluster around these important price zones. As a result, those price zones actually end up functioning as support or resistance.
3. Psychological Key Levels
Round numbers such as 100.00 yen and 150.00 yen are also points that many traders watch, making them places where you should draw horizontal lines. These prices carry psychological significance, and many orders cluster around them.
4. Large Orders from Institutional Investors
Orders from large players such as major financial institutions and central banks also influence the formation of important price levels. When these large orders concentrate in a particular price zone, price tends to stall at that level.
How to Draw Horizontal Lines

To draw effective horizontal lines, it is important to keep the following points in mind.
1. Identify Important Price Zones
Draw horizontal lines focusing on price zones like the following on the chart.
- Important highs and lows in Dow Theory
- The neckline of a double top or bottom
- The neckline of a head and shoulders
- The range high and low of price zones where price stalled for a long time in the past
- Price zones where price reacted multiple times
For example, if price has a history of falling back from around 145.00 yen many times, draw a horizontal line at that level.
2. Check Higher Timeframes
It is important to check important price zones not only on short-term horizontal lines but also on higher timeframes such as the daily chart and weekly chart. The higher the timeframe on which a horizontal level can be identified, the stronger its influence tends to be and the longer it tends to last.
3. Check Round Numbers
Round numbers such as 100.00 yen and 110.00 yen, as well as “halfway” numbers such as 105.00 yen and 107.50 yen, are also price zones worth marking with horizontal lines. Pay particular attention if price has reacted at these levels in the past.
Understanding Dow Theory is also important when drawing horizontal lines. Dow Theory is covered in the article below, so be sure to check it out as well.

Criteria for Judging the Importance of Horizontal Levels
Not all horizontal levels carry the same weight. It is a good idea to judge their importance using the following criteria.
1. Number of Reactions
The more times price has reacted to a horizontal level, the more reliable it becomes as future resistance or support. Price zones with three or more reactions deserve particular attention.
2. Size of the Timeframe
Horizontal lines drawn on higher timeframes such as the daily chart or weekly chart are stronger than those drawn on the 15-minute chart (M15) or 1-hour chart (H1).
3. Recent Reactions
The more recently price has reacted to a zone, the more reliable it tends to be. This is because market memory fades over time.
We judge the strength of a horizontal level based on points like those above. Also, although a horizontal level is drawn as a single line, it is better to think of it as a “price zone” to some extent. For example, it is a good idea to treat it as an area with some width, such as 143.80 yen to 144.20 yen.
Trading Strategies Using Horizontal Levels
Once you understand horizontal levels, let’s look at how to put them to use in your trading.
1. Trading the Bounce
The most basic strategy is to buy the bounce from a horizontal level acting as support, and sell the pullback from a horizontal level acting as resistance.
Example:
- Price falls and approaches a horizontal level acting as strong support
- Confirm signs of a bounce with candlestick patterns on the lower timeframe
- Enter long
- Stop loss below the support line, or at the Dow Theory pullback low
- Take profit just before the next horizontal level acting as resistance
2. Trading the Role Reversal
The key point is that once a horizontal level acting as resistance is broken, it can become support, and a horizontal level acting as support can become resistance; their “roles reverse.” This is called a “role reversal.”
Example:
- Price rises and breaks through a horizontal level that has acted as long-term resistance
- Then confirm price falling back to the horizontal level
- Enter long
- Stop loss below the broken horizontal level, or at the Dow Theory pullback low
- Take profit at the next important horizontal level
Things to Watch Out for When Using Horizontal Levels
Horizontal levels are a powerful tool, but there are a few things to watch out for.
1. They Are Not Absolute
The price zone shown by a horizontal level is not an “unbreakable wall” but a zone where price is statistically likely to react. Keep in mind that price will not always react there.
2. Combine Them with Dow Theory
It is important not to rely on horizontal levels alone but to also consider the market context derived from Dow Theory.
It is no exaggeration to say that Dow Theory is the foundation of everything in FX technical trading.
3. Use Multi-Timeframe Analysis Alongside
To make your trades more accurate, it is also important to perform multi-timeframe analysis that includes other timeframes.
With multi-timeframe analysis, you will start to see where you should wait and where to take profit after entering.
Please take a look at the article below.

Summary: Make Horizontal Levels Work for You
Horizontal levels are a foundation of technical analysis and an important concept used by many successful traders. By identifying important past price zones and anticipating how they will function in the future, you can improve the accuracy of your trades.
Especially in the technical-analysis-based day trading recommended on this site, understanding and using horizontal levels is the key to success. Open a chart and practice drawing horizontal lines at important price zones yourself.
Next time, we will cover “How to Use Moving Averages Correctly – Can You Win with the Golden Cross?!” By combining them with horizontal levels, let’s build even more effective trading strategies.