Fibonacci Retracement – Forecasting Retracement Depth Like the Pros
FX trading can involve a wide range of technical analysis tools, and Fibonacci retracement is one that many traders like to use. It is used as a way to forecast how far the market will retrace. This article explains Fibonacci, from its basic concepts to practical use, as a tool that supports the Dow Theory, horizontal levels and multi-timeframe analysis recommended on this site.
The Curious Connection Between the Fibonacci Sequence and Trading

Fibonacci refers to a number sequence named after Leonardo Fibonacci, a 13th-century Italian mathematician. The sequence runs “0, 1, 1, 2, 3, 5, 8, 13, 21, 34…”, and its defining feature is that adding the previous two numbers gives you the next one.
Interestingly, certain ratios derived from this sequence (especially the roughly 0.618 known as the “golden ratio”) appear in many places in nature. You can see them in the spirals of seashells, the arrangement of sunflower seeds, and even in the structure of galaxies.
And this ratio found in nature is thought to have some influence on price movements in financial markets as well.
The Basic Theory of Fibonacci Retracement
Fibonacci retracement is a tool for forecasting the depth of a correction (retracement) after a trend has formed. In a trending market, price does not move in a straight line; it advances while repeatedly correcting (retracing). Fibonacci ratios serve as a reference when estimating how deep these corrections will be.
The main Fibonacci retracement levels are as follows.
- 23.6%
- 38.2%
- 50.0% (not derived directly from the Fibonacci sequence, but included as an important key level)
- 61.8% (the golden ratio)
- 78.6%
In particular, the levels to watch are 38.2%, 50.0% and 61.8%, and many traders pay attention to these three.
Market Participants’ Psychology Makes Fibonacci Work
Why do Fibonacci ratios affect the market? The answer lies in “crowd psychology” and the “self-fulfilling prophecy.” Because many traders watch Fibonacci levels and trade at those levels, the levels actually end up working as important key levels.
For example, if many traders place buy orders at the 61.8% retracement level, buying pressure increases when price actually reaches that level, making a bounce more likely. This is the self-fulfilling prophecy effect.
There is also a theory that, since this ratio is so widespread in nature, it is somehow built into human psychology as well. Either way, quite a few traders have felt firsthand how effective Fibonacci can be in the market.
How to Draw Fibonacci Retracement Correctly
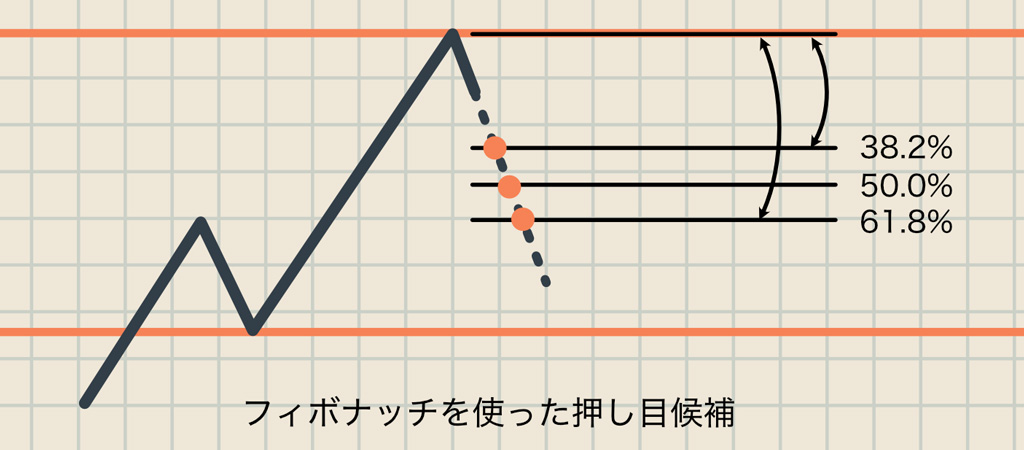
To draw Fibonacci retracement correctly, it is important to identify the right swing high (high) and swing low (low).
In an uptrend
- Use the most recent significant low (swing low) as the starting point
- Use the subsequent significant high (swing high) as the end point
- Apply the Fibonacci retracement tool to this price zone
In a downtrend
- Use the most recent significant high (swing high) as the starting point
- Use the subsequent significant low (swing low) as the end point
- Apply the Fibonacci retracement tool to this price zone
The key point here is which high and low you choose. By choosing highs and lows that are important key levels based on Dow Theory, you can set more reliable Fibonacci levels.
How Usage Differs Between Uptrends and Downtrends
Fibonacci retracement is a useful reference in both uptrends and downtrends, but there are slight differences in how it is used.
Using It in an Uptrend
In an uptrend, when price corrects (falls), it becomes more likely to bounce at the main Fibonacci levels (especially 38.2%, 50.0% and 61.8%). These levels are watched as buy entry points.
As a strategy, once a correction (decline) begins in an uptrending market, focus on the main Fibonacci levels and wait for signs of a bounce at those levels. If you see a sign of a bounce, consider a buy entry.
Using It in a Downtrend
In a downtrend, when price rebounds (rises), it is expected to retrace up to a Fibonacci level and then turn lower again. These levels are watched as sell entry points.
Once a temporary rebound (rise) begins in a downtrending market, focus on the main Fibonacci levels and wait for signs of a pullback lower at those levels. If you see such a sign, consider a sell entry.
Combining Fibonacci Retracement with Horizontal Levels
To make Fibonacci retracement more effective, it helps to combine it with other technical analysis tools. Combining it with horizontal levels (support and resistance lines) in particular helps improve the accuracy of entry points.
For example, when an important horizontal level lines up with a main Fibonacci level (38.2%, 50.0%, 61.8%), the chance of a bounce or a reversal lower at that level increases even further. When multiple analysis methods point to the same level as important, you can find entry points with greater certainty.
Setting Take Profit Targets with Fibonacci Extension
Fibonacci can be used not only to forecast retracement depth but also to project target levels for the next move. This is Fibonacci extension.
The main Fibonacci extension levels are as follows.
- 127.2%
- 161.8%
- 261.8%
For example, if you buy after a correction in an uptrend, these extension levels beyond the previous high (swing high) may become take profit targets. The 161.8% level in particular is watched by many traders and can become an important key level.
Common Mistakes and How to Avoid Them
Let’s look at common mistakes when using Fibonacci retracement and how to avoid them.
1. Failing to Choose the Right Swing Points
The most common mistake is failing to choose the right swing high and swing low. The market has many highs and lows, but not all of them are important swing points.
How to avoid it:
Understand Dow Theory and develop the ability to identify significant highs and lows. It is also important to perform multi-timeframe analysis and choose swing points that are also considered important on the higher timeframe.
2. Entering Based on Fibonacci Levels Alone
Entering just because price has reached a Fibonacci level is also dangerous. It is not uncommon for price to break through the level easily.
How to avoid it:
In addition to the Fibonacci level, check candlestick patterns and confluence with horizontal levels. Fibonacci levels that line up with a horizontal level tend to become important key levels and make more reliable entry points. It is also important to confirm whether price is actually “reacting” at the Fibonacci level.
3. Ignoring the Trend Direction
Ignoring the overall market context and trend direction when using Fibonacci also leads to mistakes.
How to avoid it:
Be thorough with multi-timeframe analysis and always check the trend direction on the higher timeframe. It is important to trade with the market context and trend direction of the larger timeframes in mind. Make buying in an uptrend and selling in a downtrend your baseline, and use Fibonacci only as a supporting tool to narrow down entry points.
Example: Fibonacci Analysis on a GBP/JPY Chart
Let’s look at a real example of Fibonacci retracement using GBP/JPY, the pair recommended on this site.
The image below is an actual 1-hour chart (H1) from Apr 24, 2025.
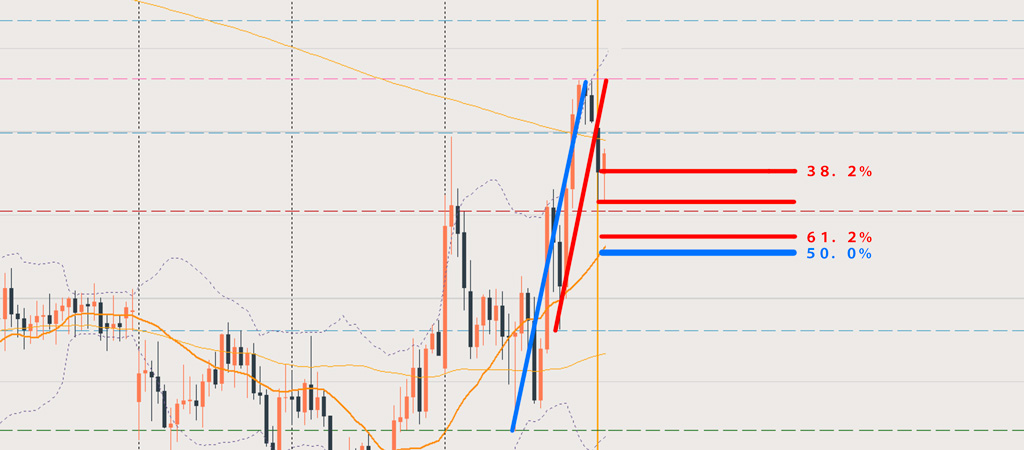
In this case, you can take the start and end points of the rise for the Fibonacci either along the red diagonal line or along the blue diagonal line. The red diagonal line marks the origin of the rise as seen on the 15-minute chart (M15), and looking closely, it can also be considered the origin on the 1-hour chart (H1).
When each diagonal line is treated as a single upswing, the pullback candidates are the four lines drawn as red and blue horizontal lines.
And here is how the day turned out.
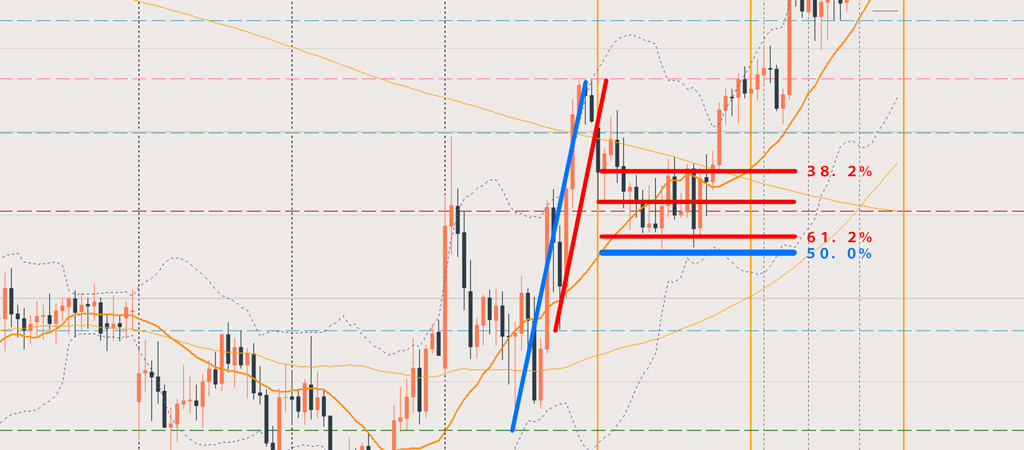
You can see that the 61.2% of the red Fibonacci and the 50% of the blue Fibonacci acted as the pullback before price rose. On this day’s chart there is also a red dashed horizontal line, which is an important key level on the daily chart. By combining horizontal levels, Dow key levels and Fibonacci like this, you can pinpoint likely pullback levels accurately.
Summary: Use Fibonacci as a Supporting Tool for Technical Analysis
Fibonacci retracement is a handy tool that complements the main analysis methods of Dow Theory, horizontal levels and multi-timeframe analysis. Used properly, you can expect the following benefits.
- You can forecast the depth of corrections and narrow down entry points
- It serves as a reference for take profit target levels
- It makes risk management and setting stop loss points easier
What matters is that Fibonacci is only a supporting tool, and it should be used on a foundation of the core analysis methods: Dow Theory, horizontal levels and multi-timeframe analysis. Entering where the evidence from multiple analysis methods overlaps lets you improve the accuracy of your trades.
For Dow Theory and multi-timeframe analysis, please also refer to the articles below.


Add Fibonacci to your technical analysis as a supporting tool and build a more accurate trading strategy.