Estimated pips are the pips that would have been gained by trading ideally along the published scenario.
Currency pair
Total pips
Posts
Average pips
GBP/JPY
+695.0 PIPS
20
34.8 PIPS
USD/JPY
+498.0 PIPS
20
24.9 PIPS
Total
+1,193.0 PIPS
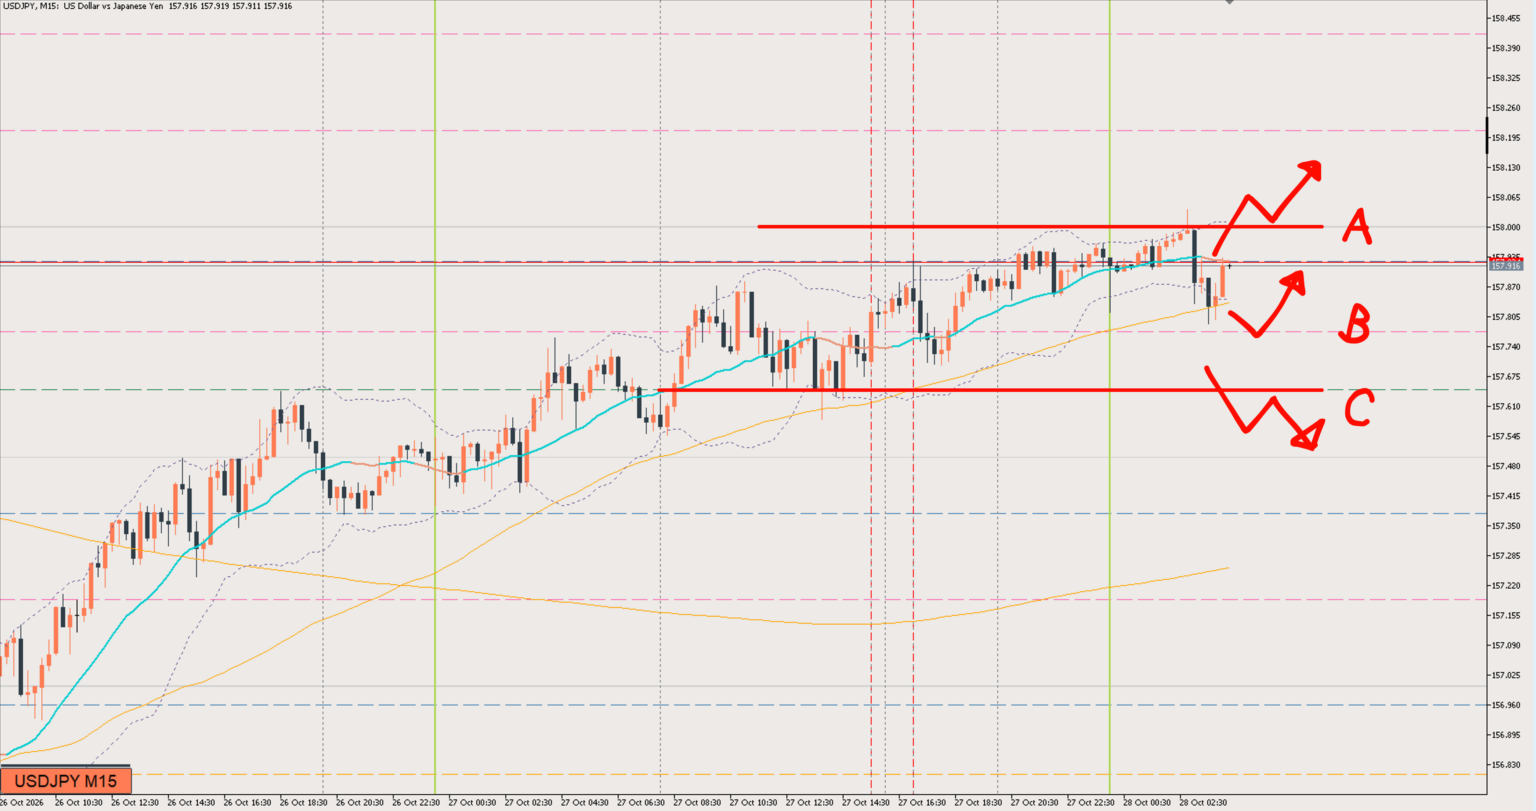
USD/JPYUSD/JPY
Sell
Buy target158
Sell target156.8
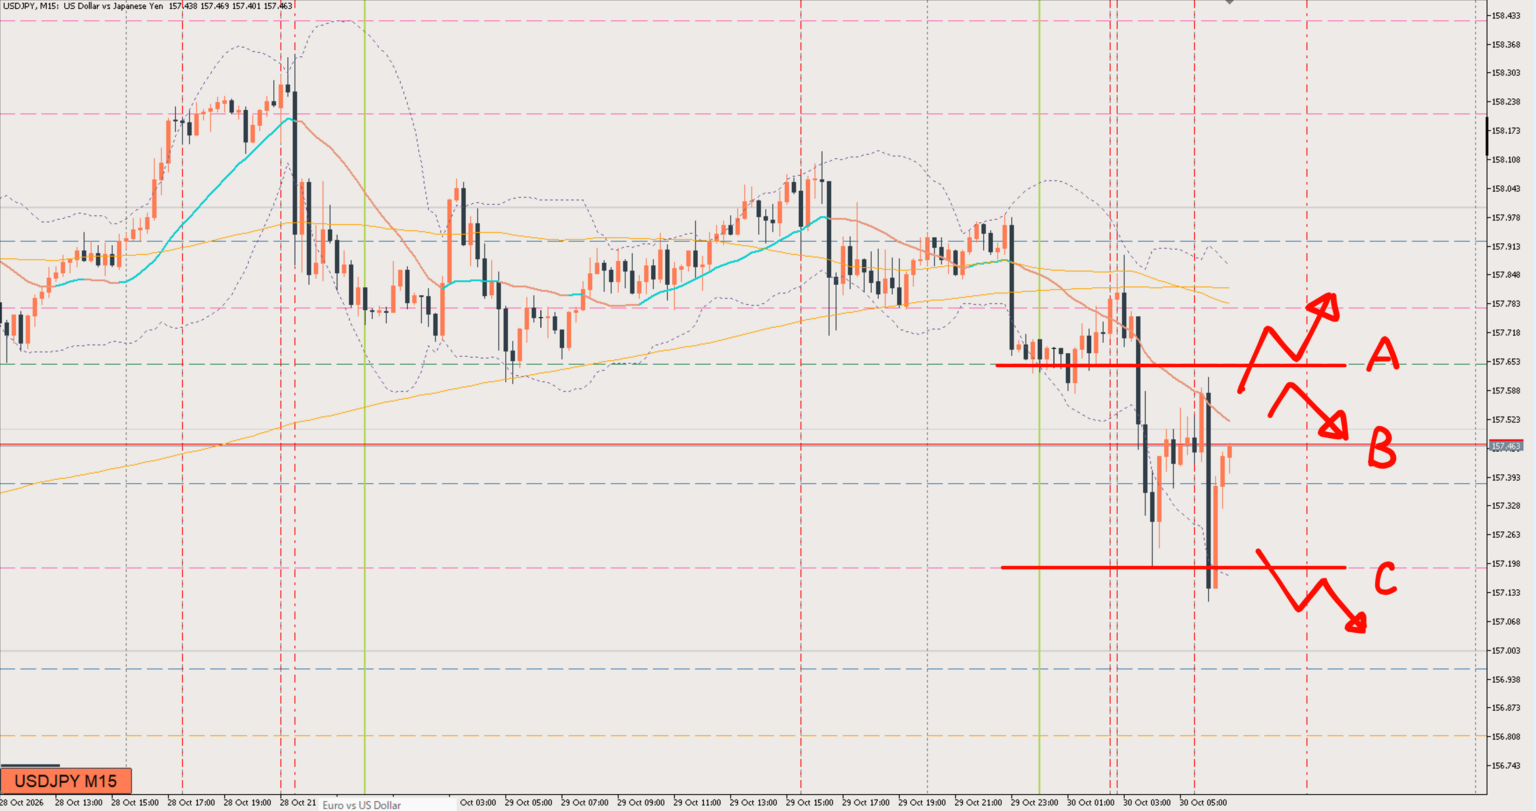
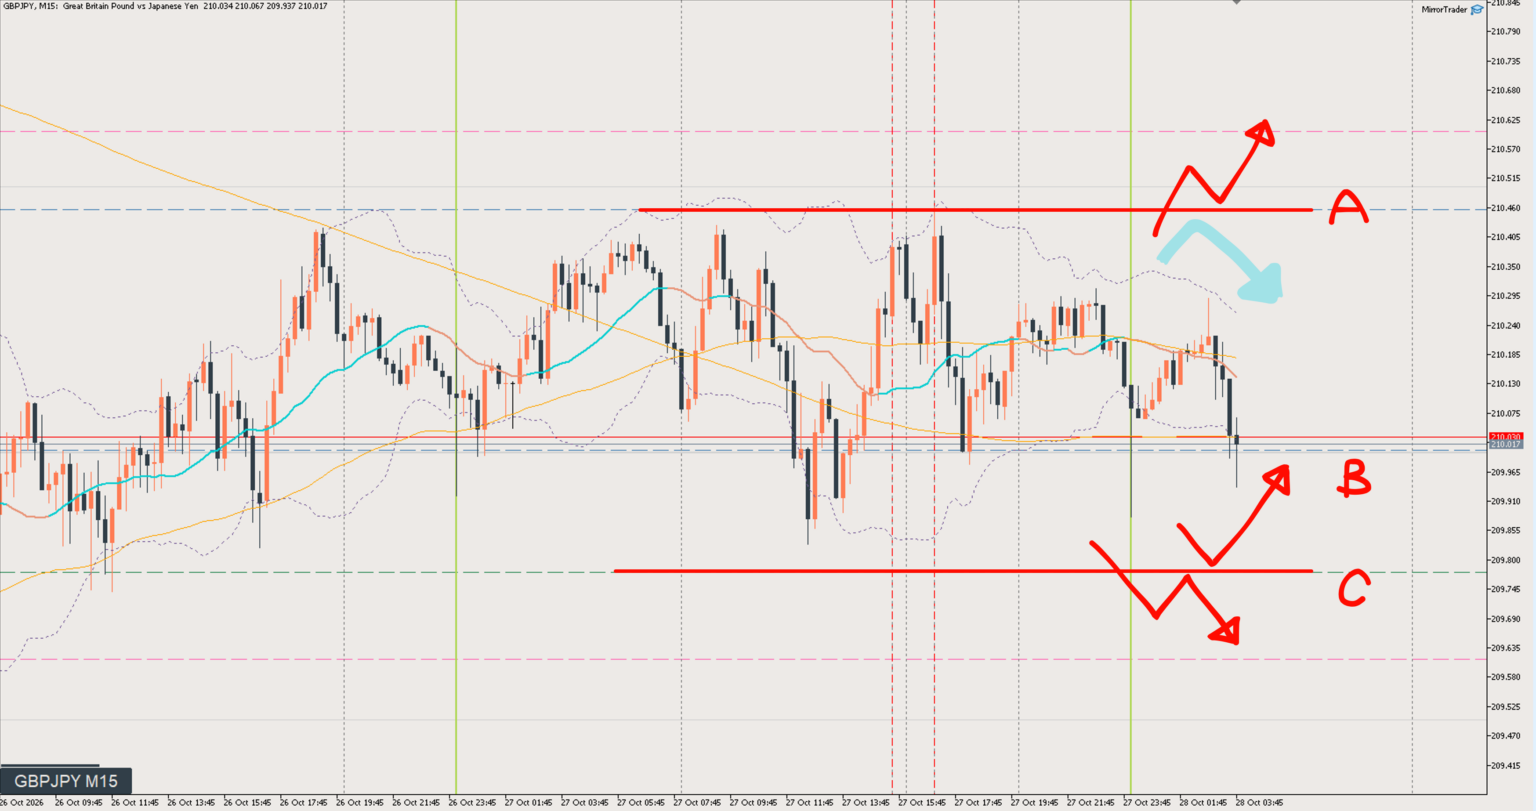
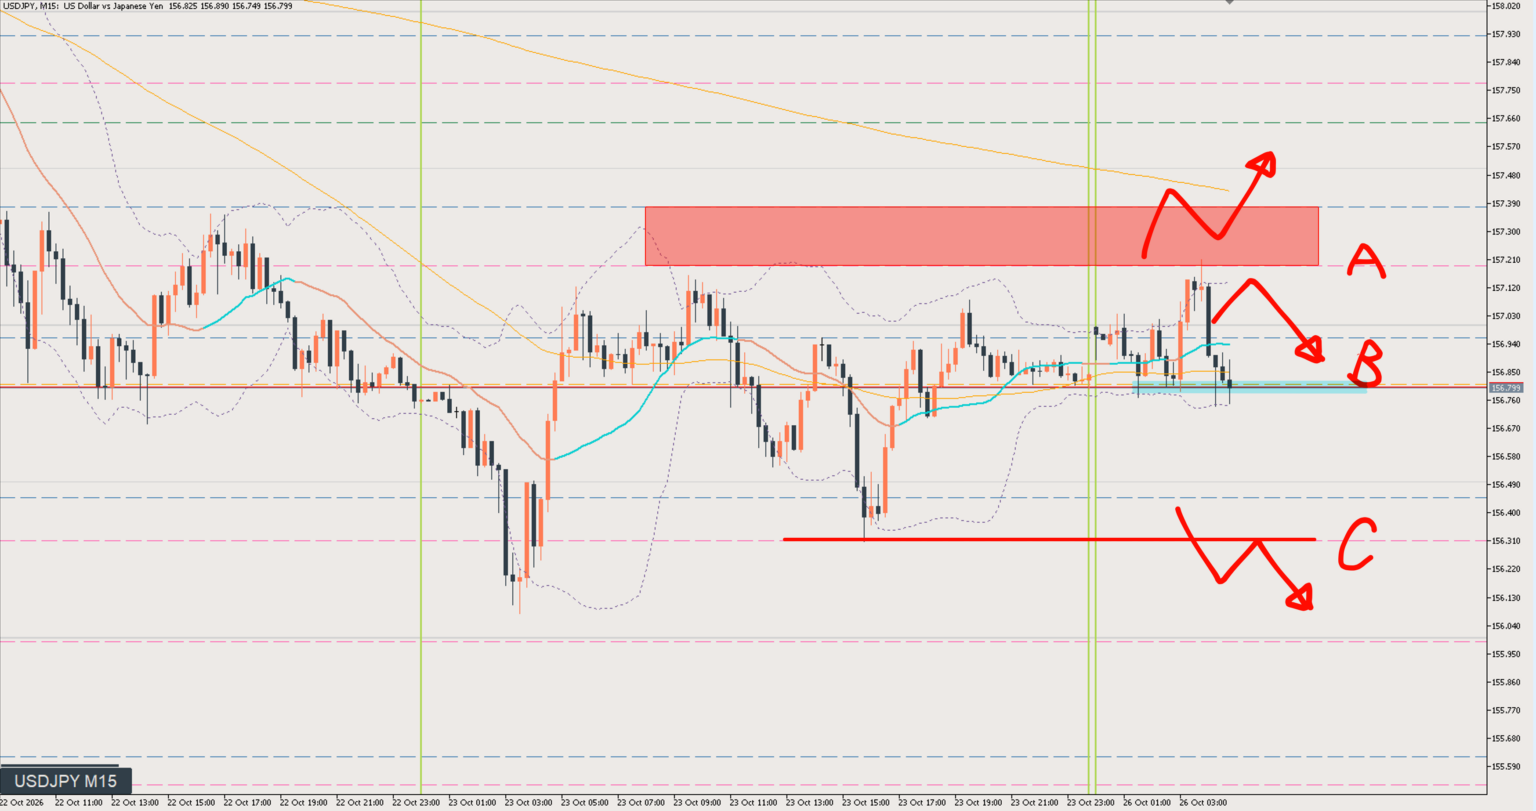
The pair has been falling since the morning and has broken below yesterday's range.However, rather than continuing to drop sharply, it has settled into a range one level lower.
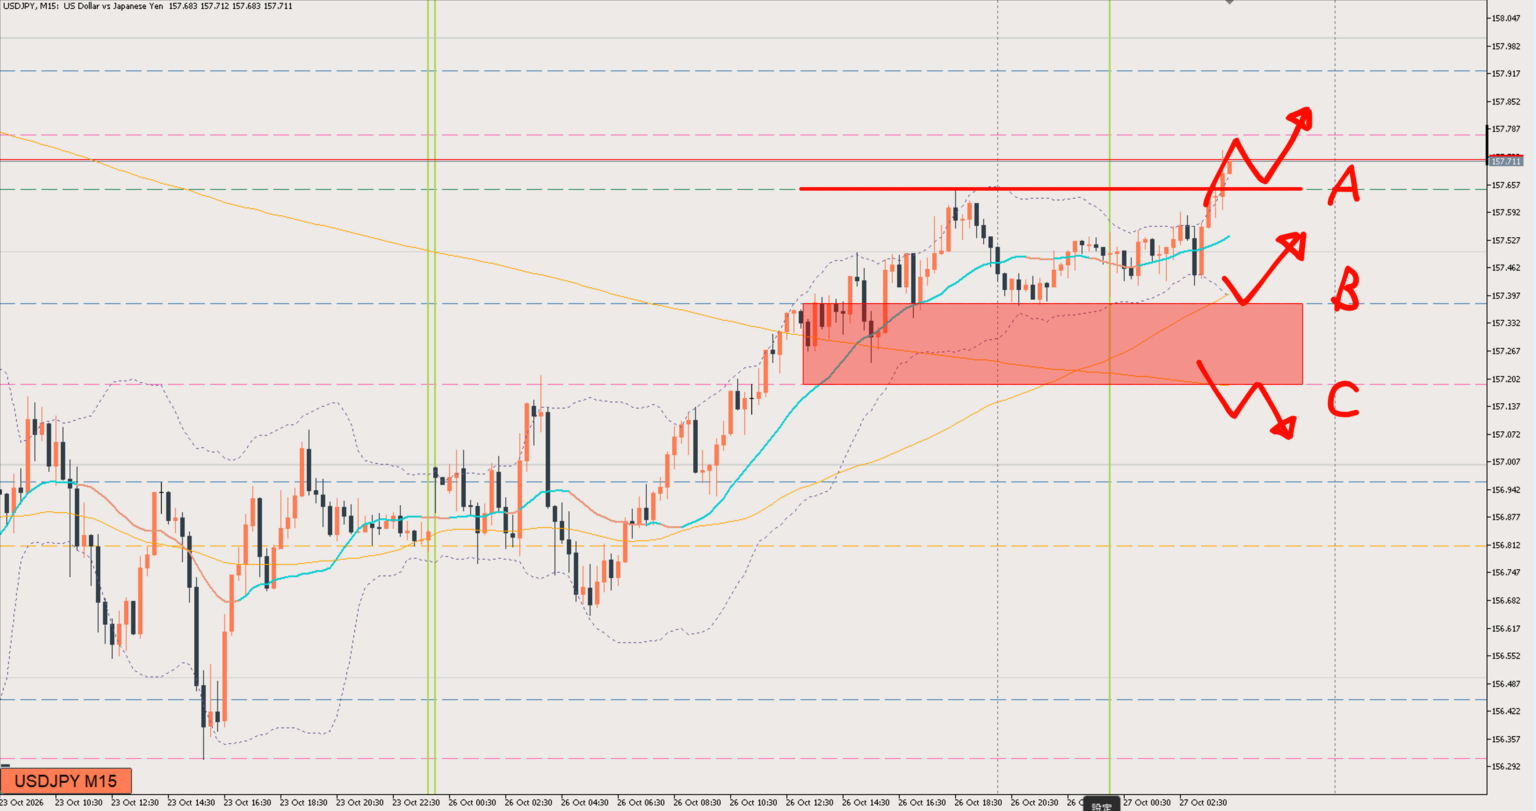
Price moved up another leg from yesterday, but it's back in a range now.From here, the key point is whether the range high from up until yesterday will act as support.
For now I have a bullish bias, but if price breaks below the C line, which is currently acting as support, I'll switch to selling.USD/JPY is one to watch today.
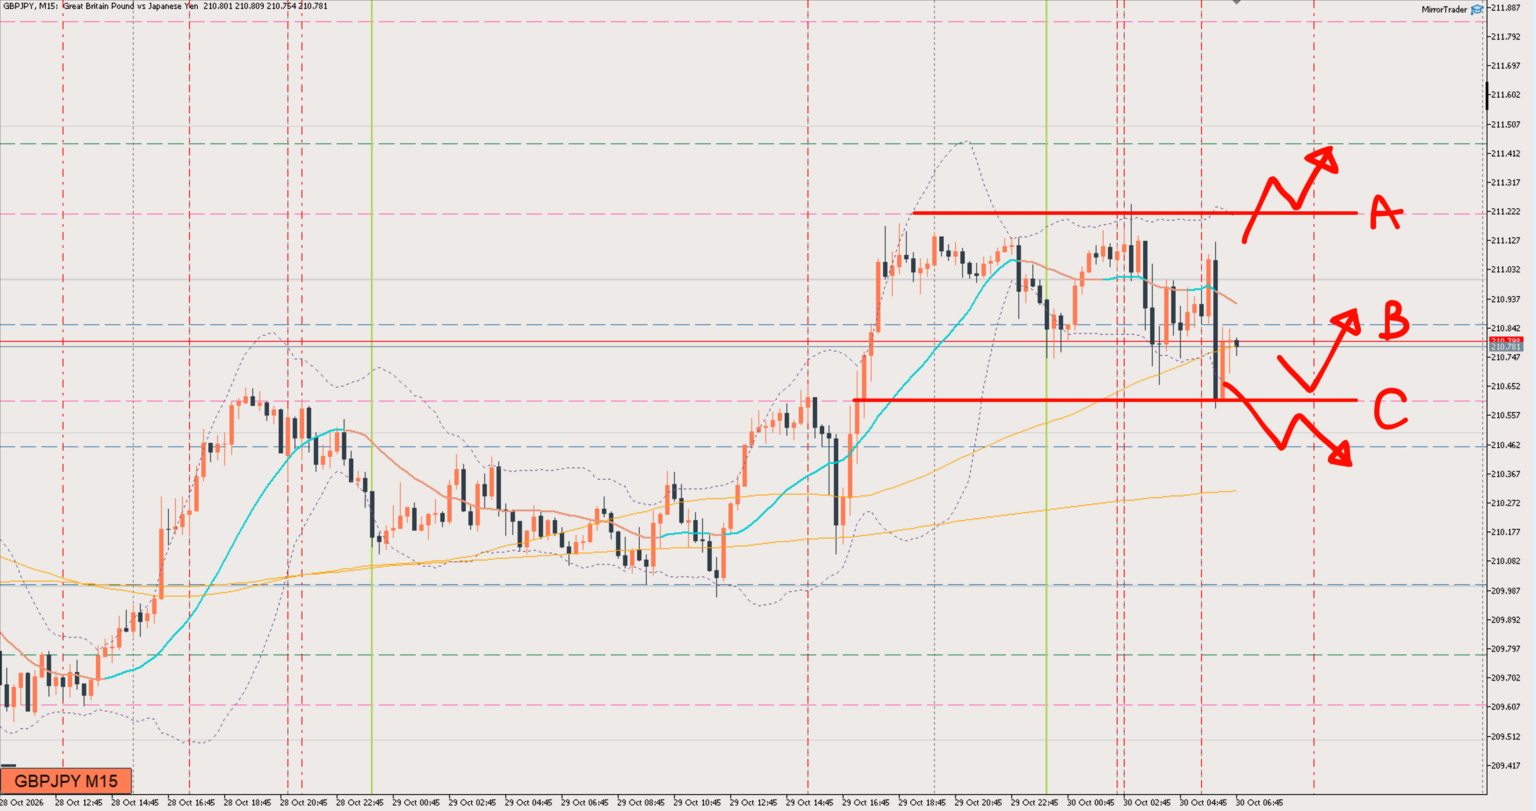
It's a tricky ranging market, but the lows are firming up and it feels like things could turn into an upward move.If price comes down to around C, the range low, it becomes easier to get involved, but I think there's also a chance it starts rising from around B. In that case, I'll have to weigh that against how far it might hold up if it drops again.
Momentum is fading, but I'm keeping a bullish bias.Price is in what you could call near the highs, so I'll also keep in mind the possibility of a turn lower from around here.
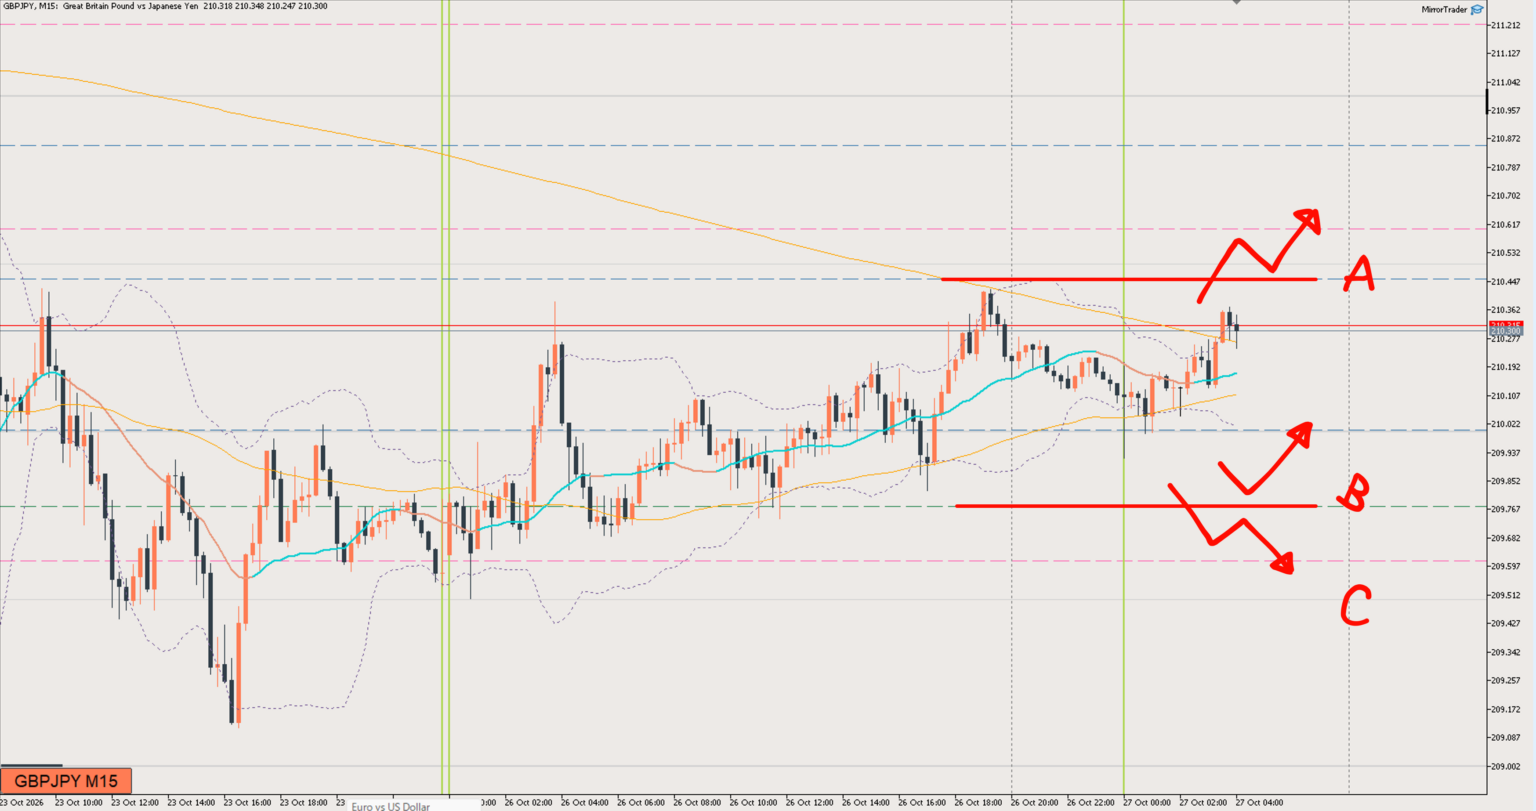
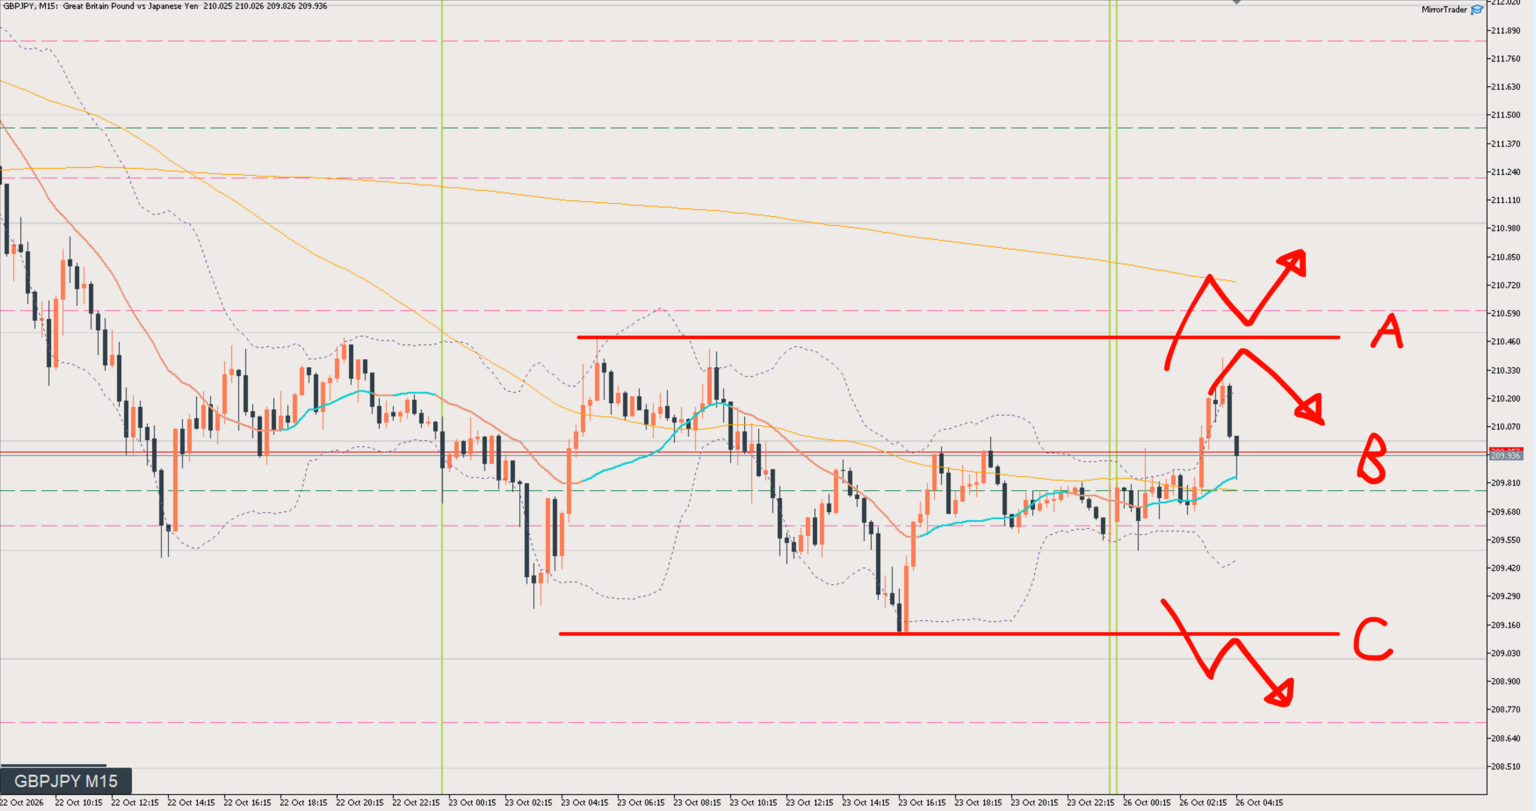
The situation is similar to yesterday.Price is basically moving within the range between A and C, and I'm looking to buy within the range.However, selling pressure comes in around Line A. This is also the same as yesterday.
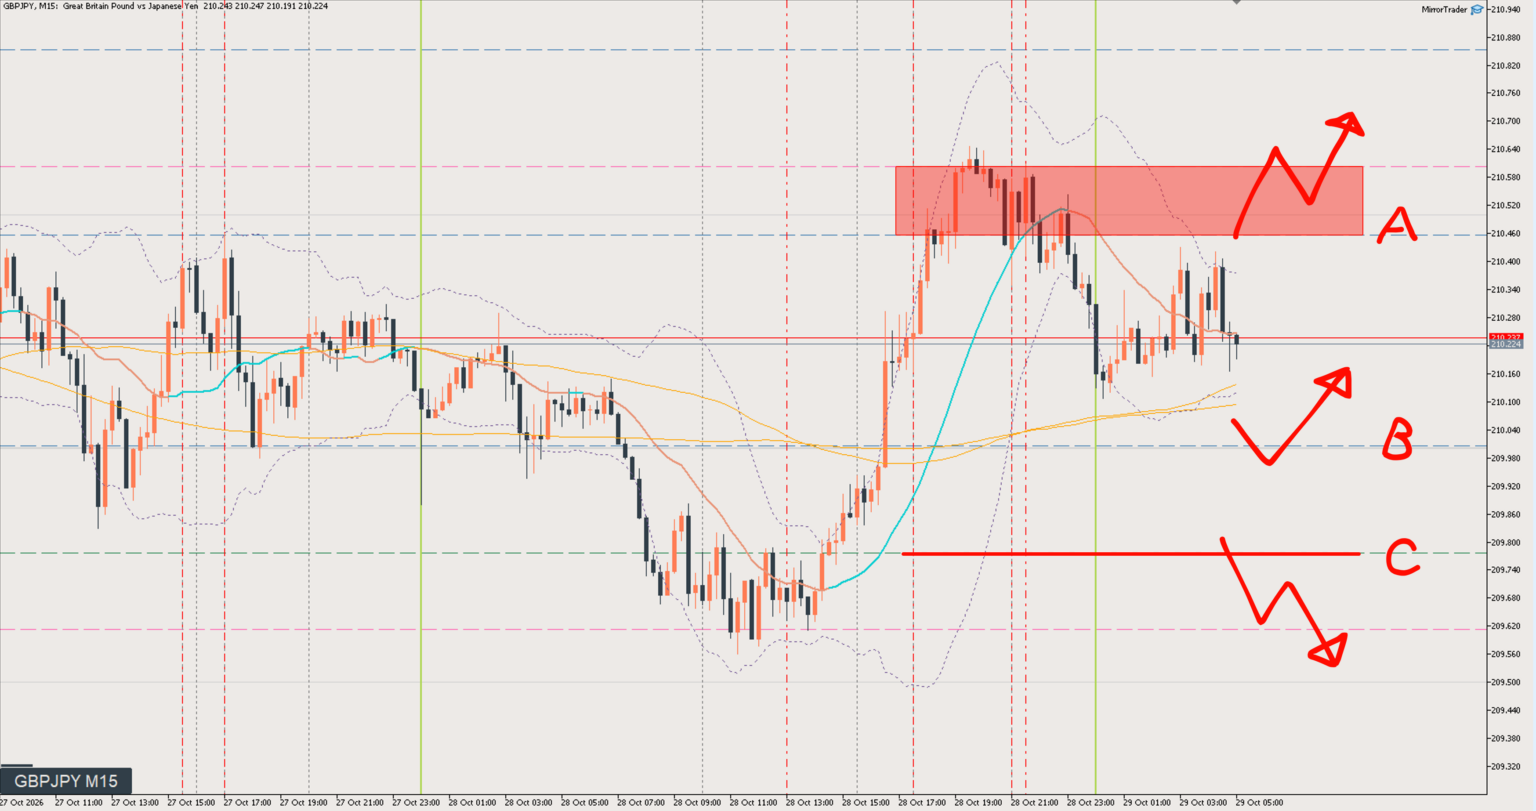
A slightly tricky situation. The 1-hour chart (H1) is ranging and leans toward selling, if anything, but the current flow is turning up (making higher lows), so my bias is bullish.On the 15-minute chart (M15), I see it as a range from A to B, so it's a question of buying from the bottom or buying after a break to the upside.
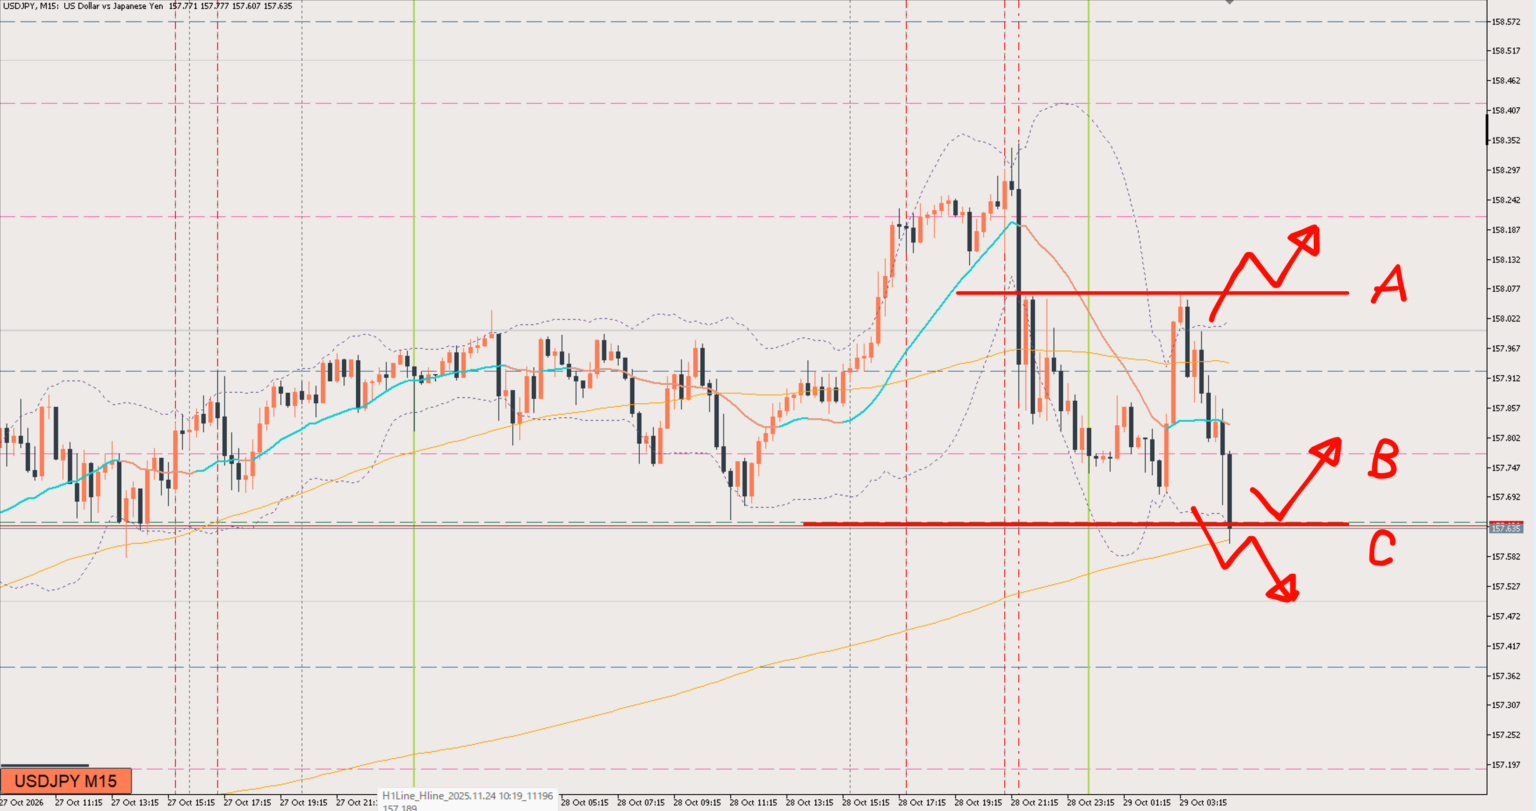
My bias is to sell, but the area around line C is right at the range low on the daily chart.A break below here looks likely to lead to further downside, but at the daily chart level this isn't a place to be selling right now.
My bias is to sell, but it's not a spot where I can sell right now.The lower timeframes are bullish, and the daily chart could also start rising from around here, so I'd like to watch how price moves a bit longer.