Estimated pips are the pips that would have been gained by trading ideally along the published scenario.
Currency pair
Total pips
Posts
Average pips
GBP/JPY
+485.0 PIPS
14
34.6 PIPS
USD/JPY
+216.0 PIPS
13
16.6 PIPS
Total
+701.0 PIPS
USD/JPYUSD/JPY
Sell
Buy target159.9
Sell target159
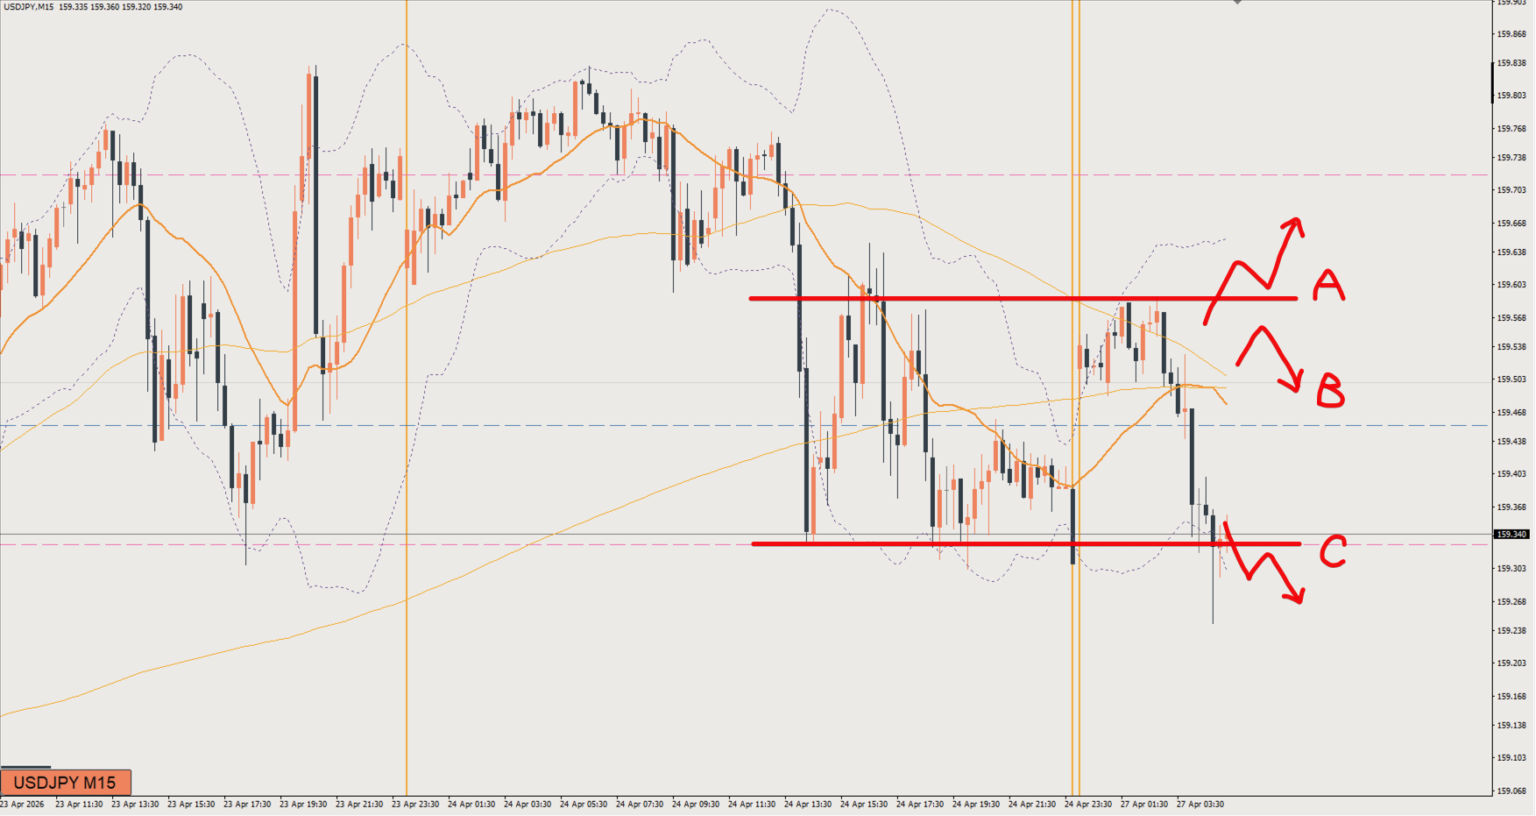
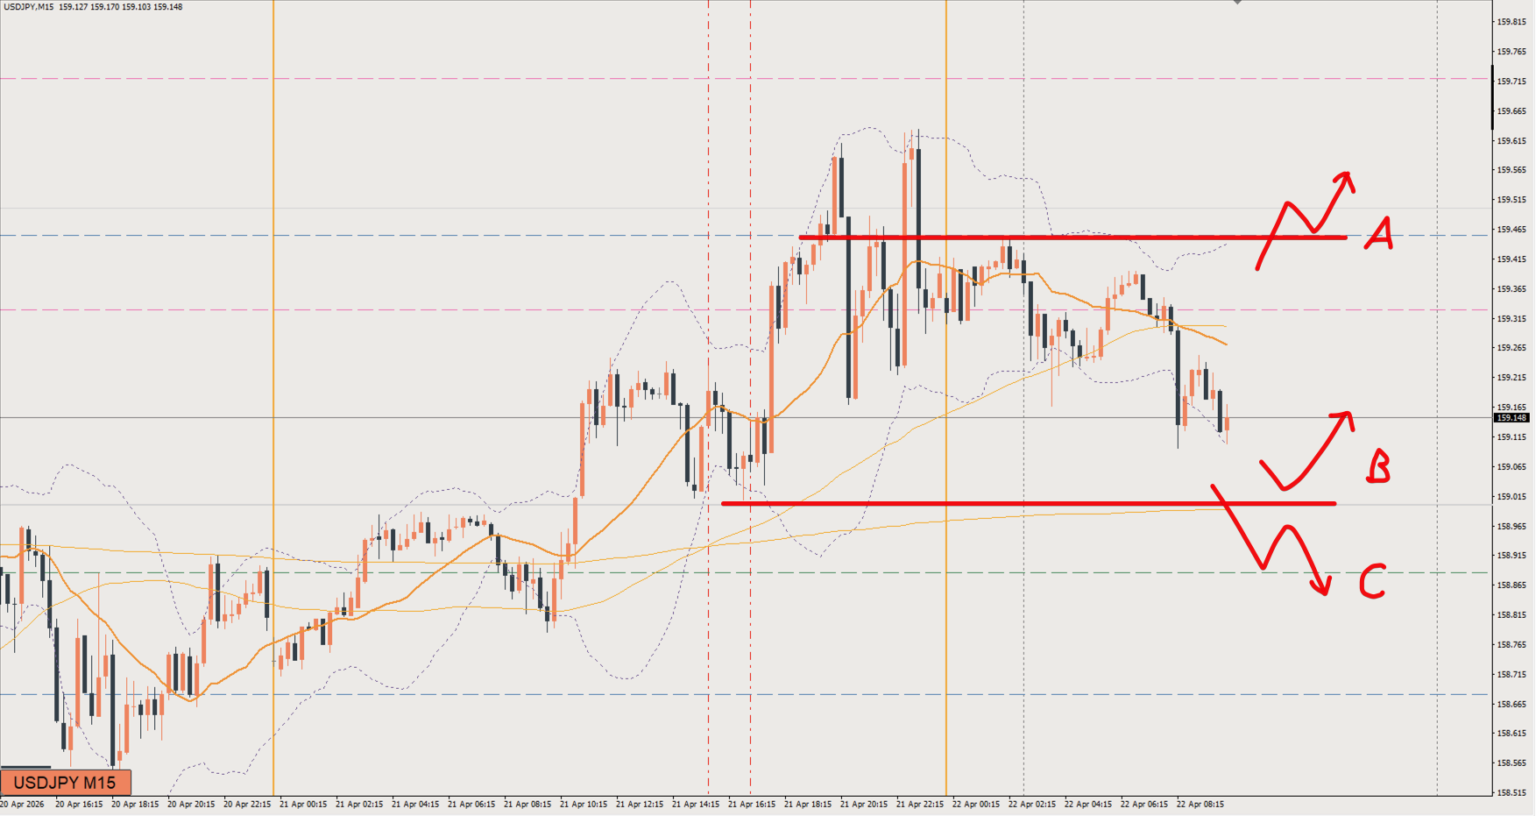
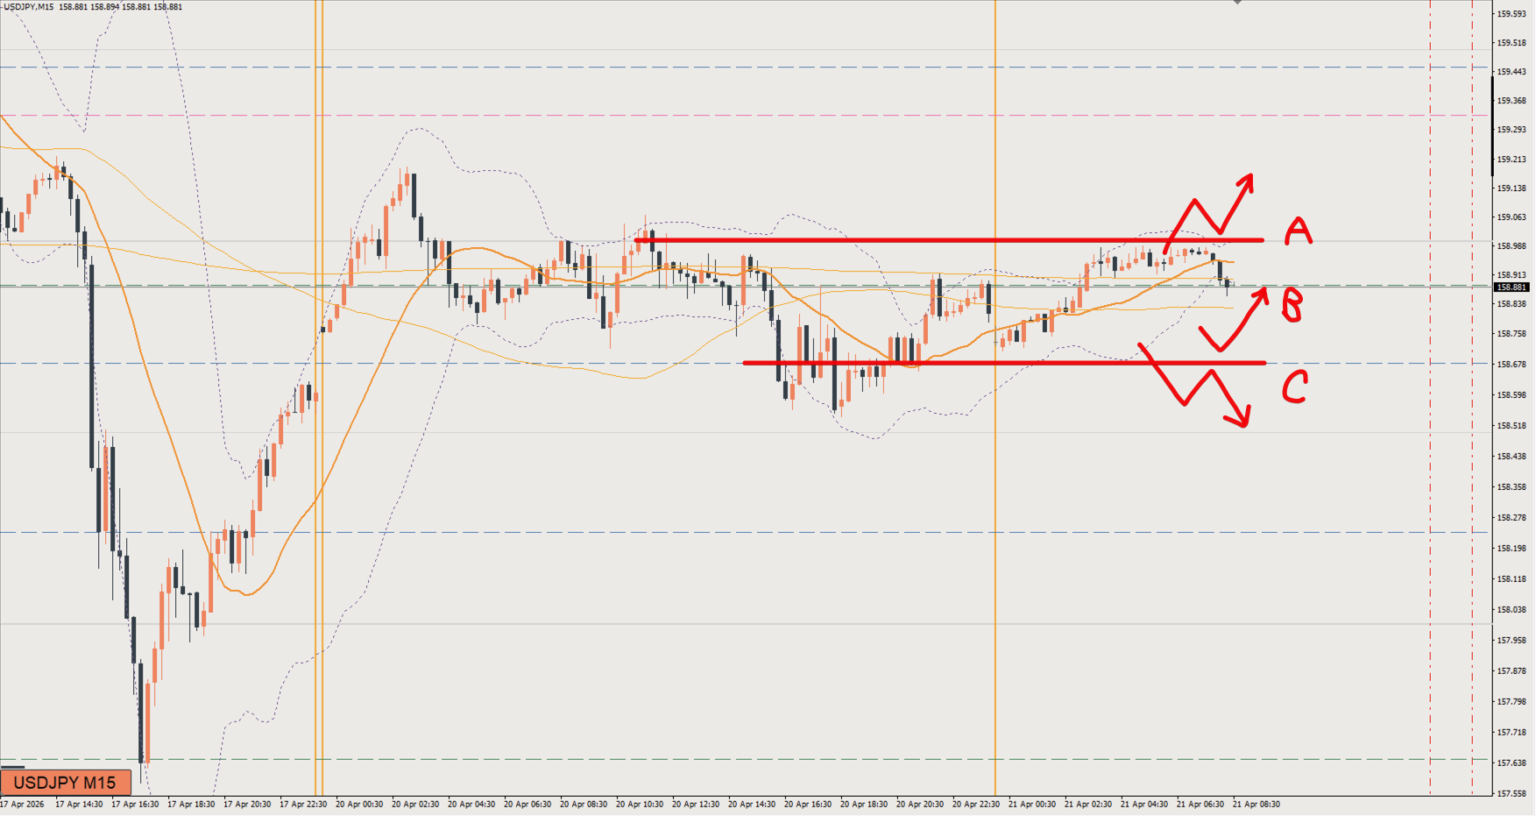
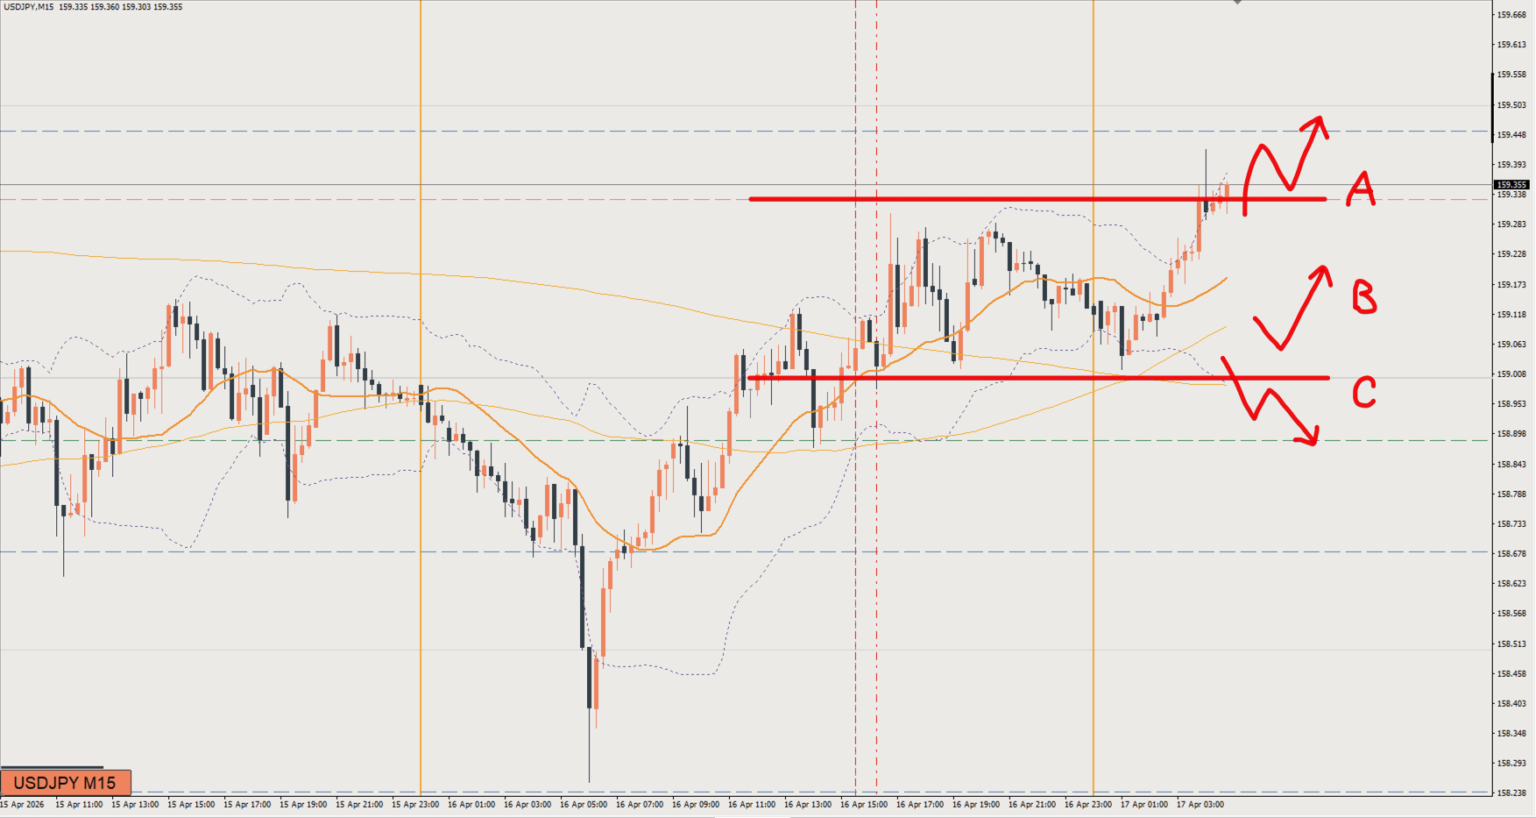
For 1-hour chart (H1) trades, it's a buy until price breaks below Line C. However, price has been turning down (making lower highs) within this range, the daily chart looks like it wants to drop, and the 15-minute chart has already made a bearish shift, so I'm taking a bearish bias.
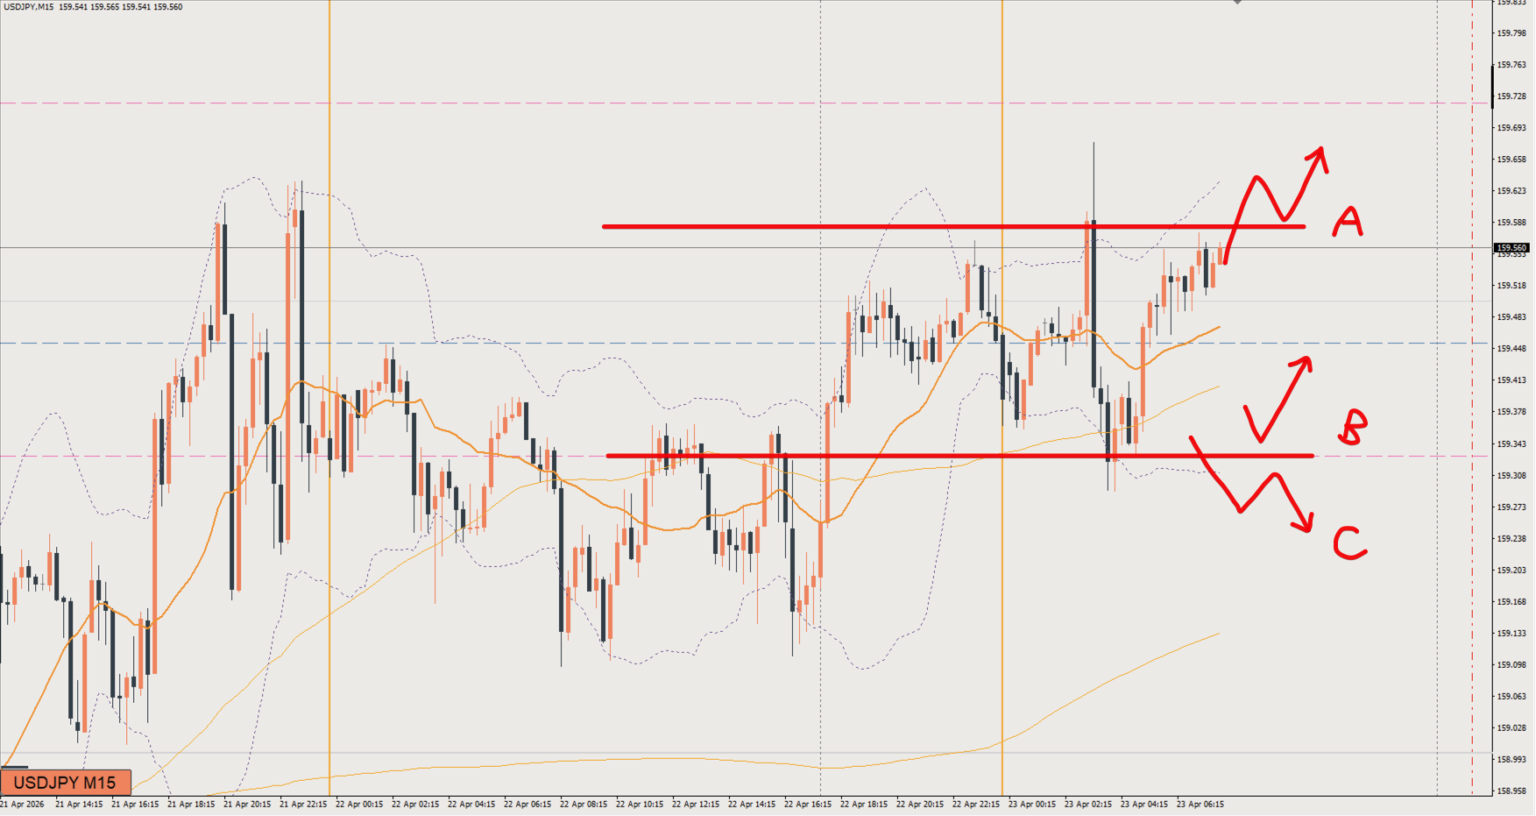
I have a bullish bias, but price is near the highs on the daily chart and the movement is sluggish.If anything, it's turning down (making lower highs), so if it can't break above this area, looking for a short-term sell is also an option.
It looks like price is being held back near the 4-hour high, but it's been making higher lows, so maybe it'll just break through from here?The daily chart also looks like it wants to go higher.
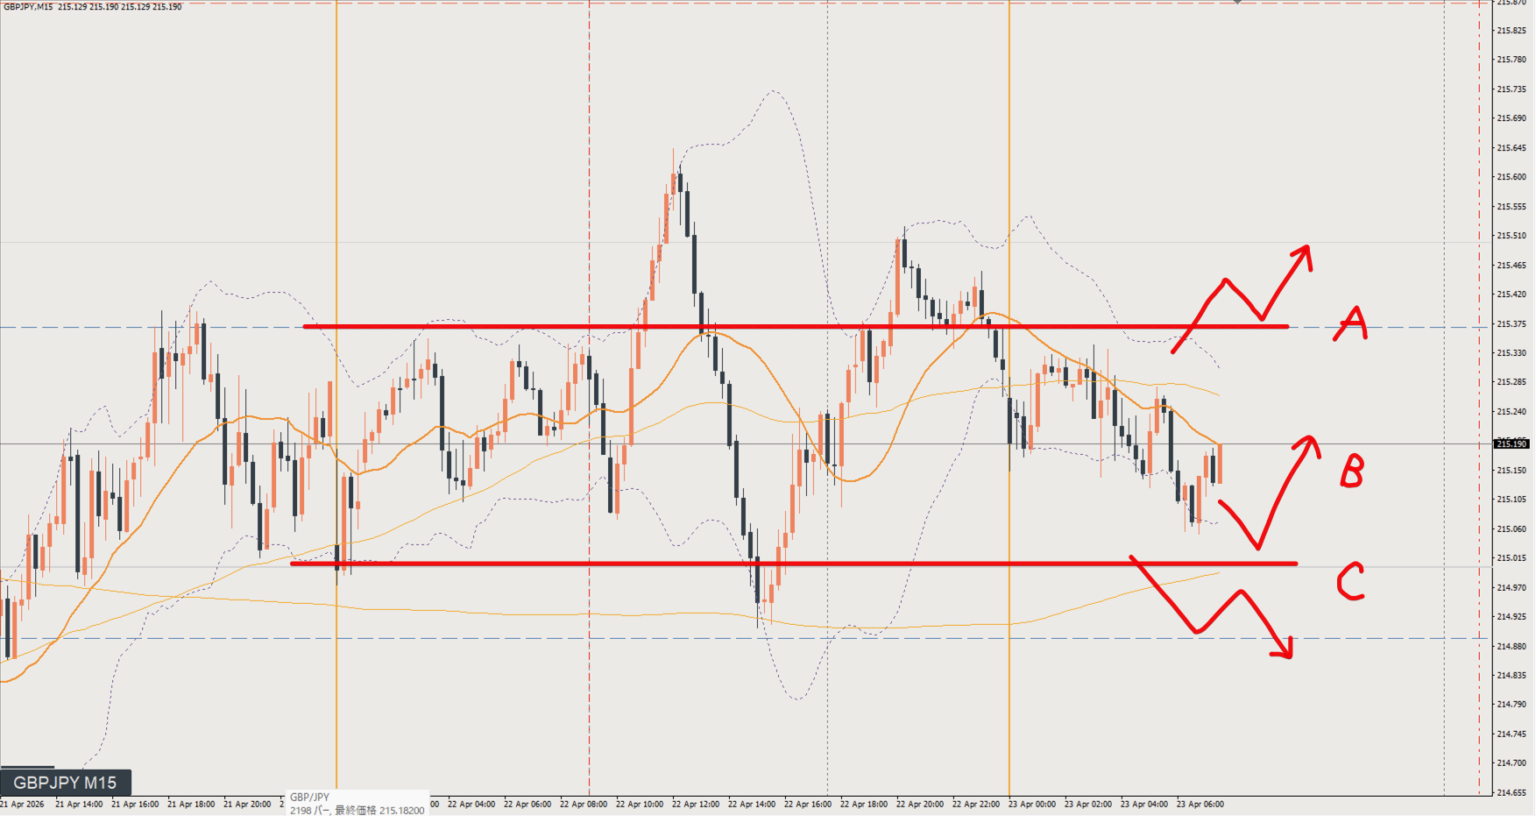
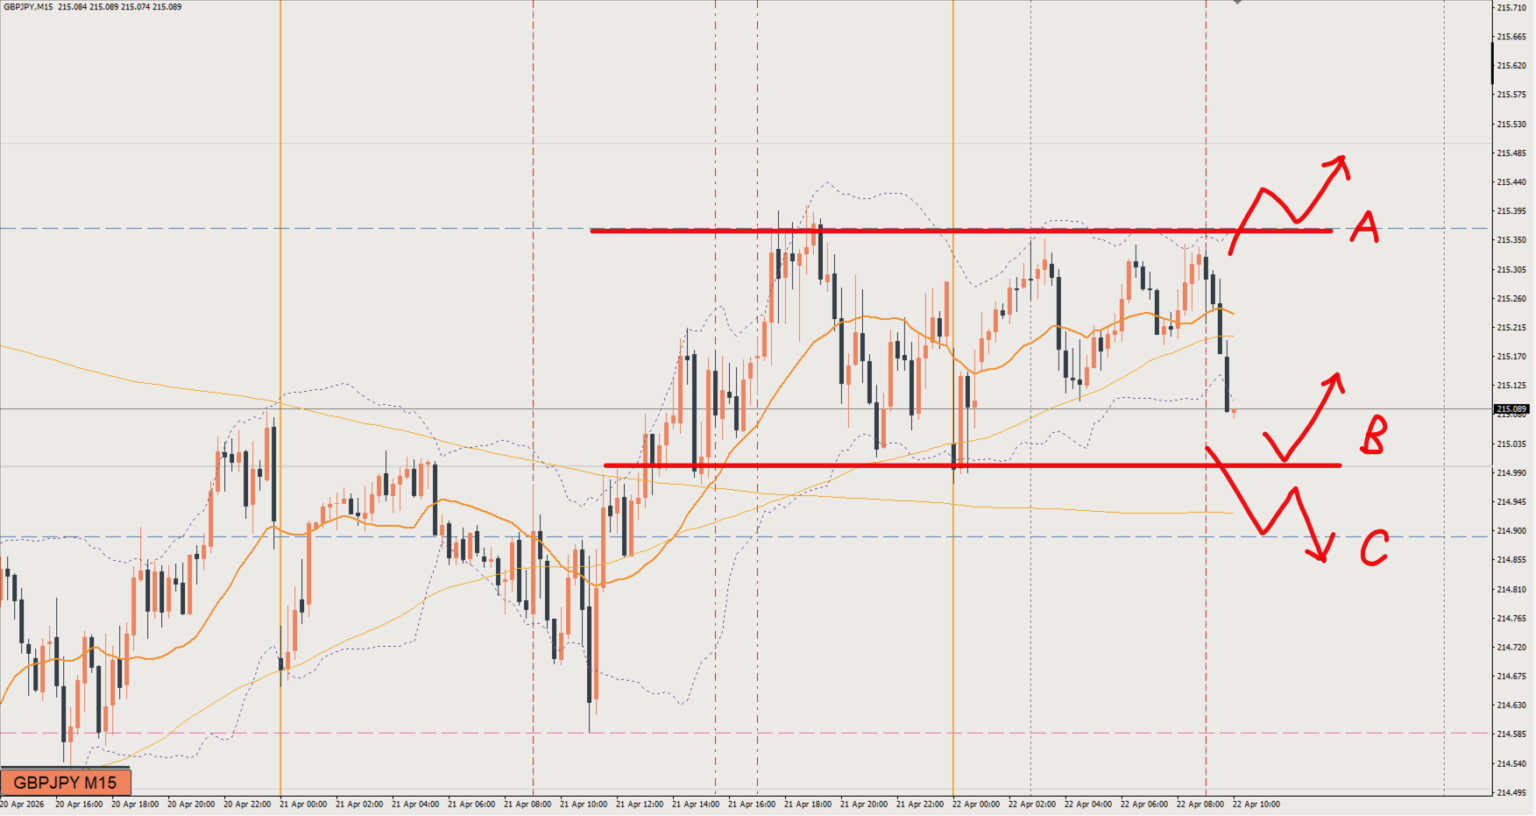
It's still a range, so not much has changed from yesterday.On the 1-hour chart (H1), a head and shoulders pattern is starting to take shape, so sellers are gaining the edge compared to yesterday.If price reverses without breaking around the C line, I'll buy; if it breaks below, I'll sell.
The situation is tricky, and it looks like plenty of people will be coming in to sell.It is still a range, though, so if price holds above the B line and we see downside stalling or turning up (making higher lows), I think it could be worth trying a buy.
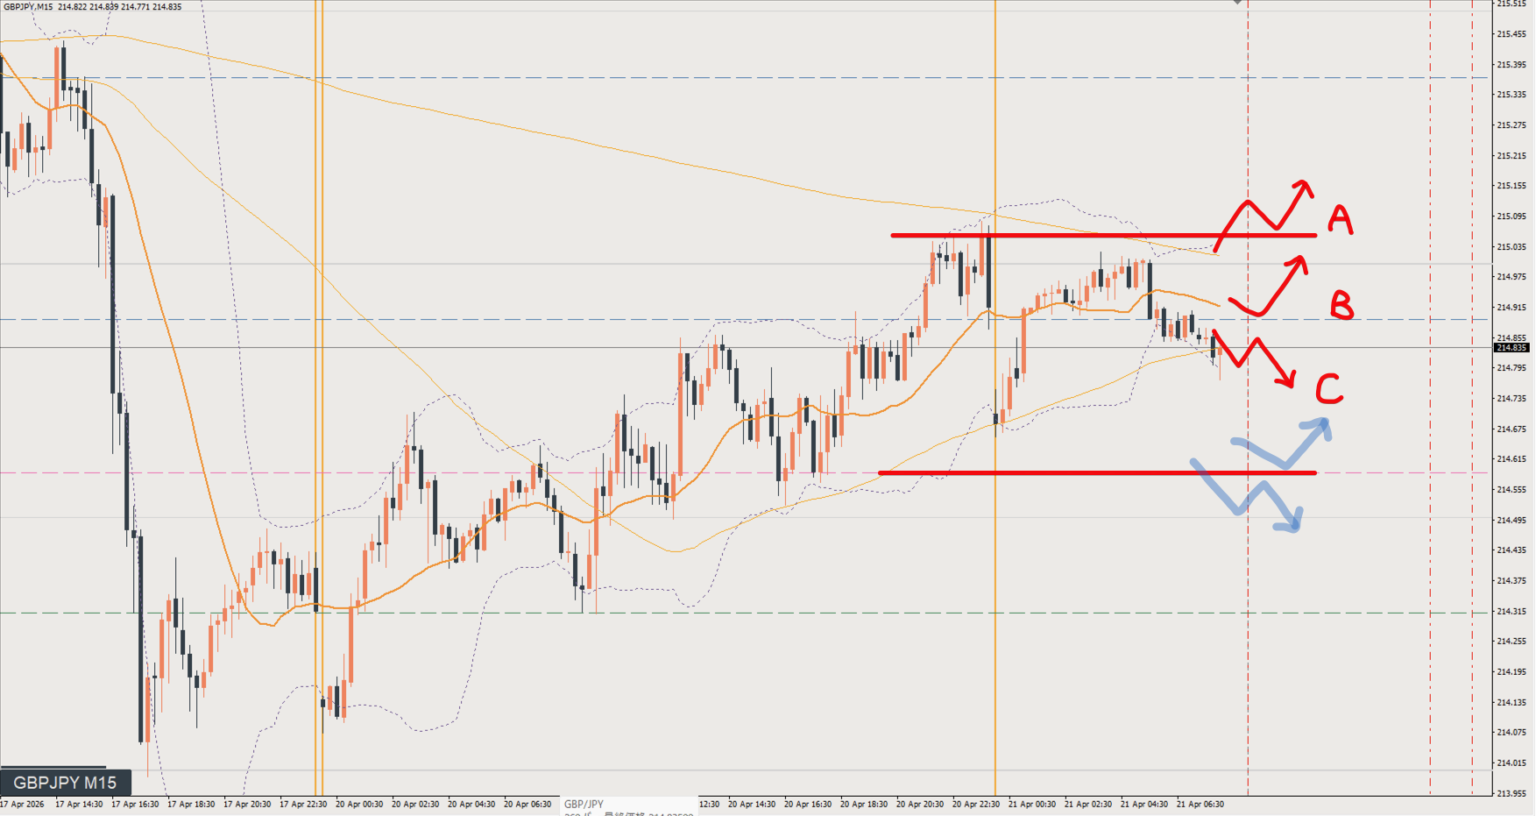
For now it's a buy, but price has been stopped several times, so it feels like it might drop for a while.If it does drop, I think we can aim for a move down to around the recent low on the 4-hour chart (H4).For now, I still have a bullish bias.If it turns up (making higher lows) near the B line, I'll be buying.
On the daily chart, the room to run keeps narrowing, so expectancy is low right now.It's a tough call whether to buy or sell, but if anything, I lean toward buying.
The daily chart says buy, the 4-hour chart (H4) says sell, and the 1-hour chart says buy, so it's a tricky situation.On the 4-hour chart (H4), we're getting to a point where selling the rally looks likely to come in.If price starts turning down (making lower highs) from here, I think a short-term short is possible.
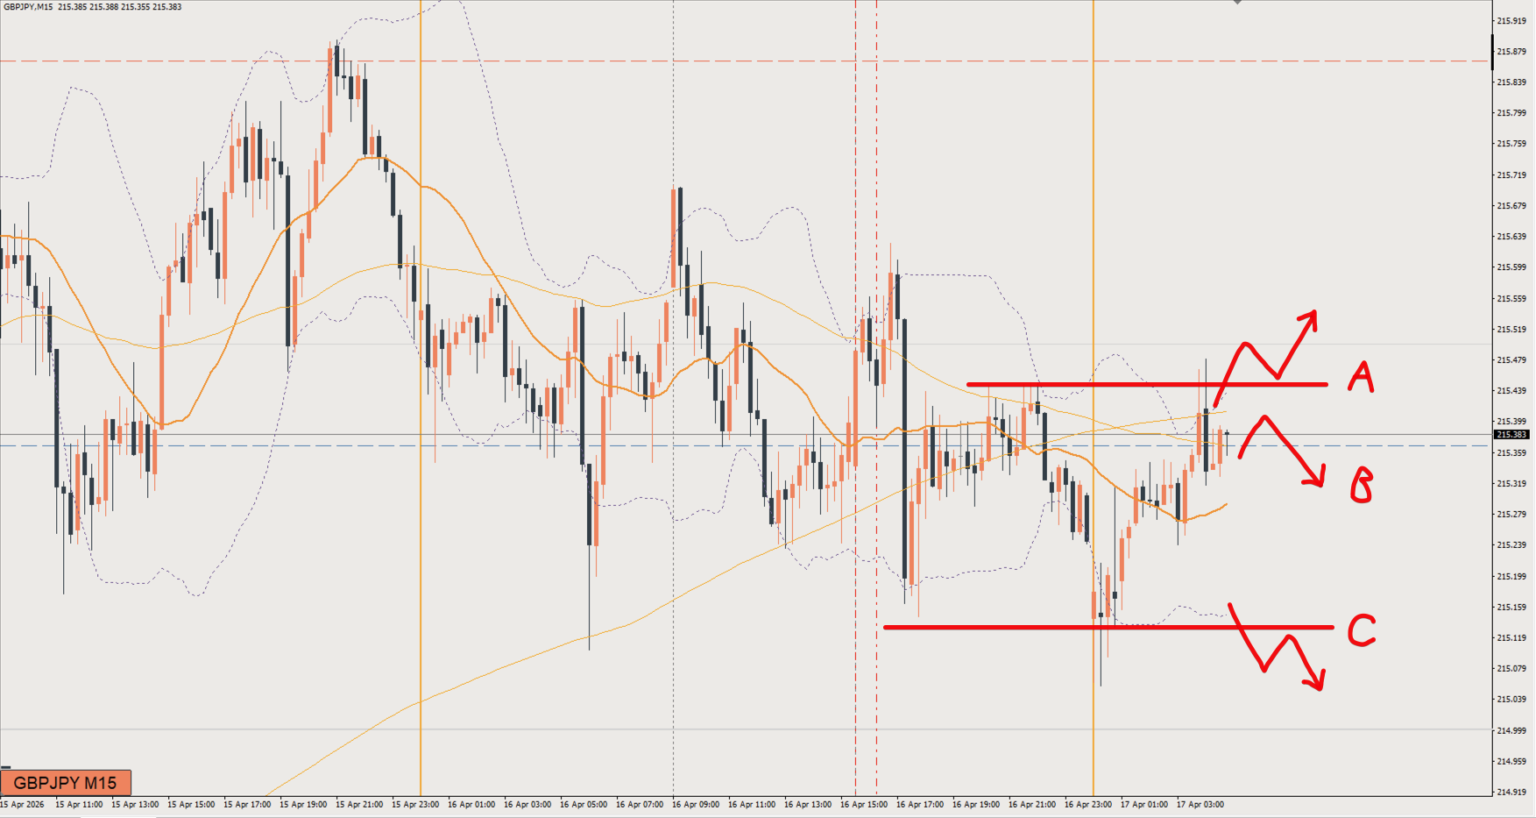
Around 8 am JST (23:00 UTC the previous day) was a good place to buy.If you're holding a position, it's still fine to hold, but the daily chart has moved into consolidation and the room to run is narrowing.If price can't break above the blue line just above A, I'd close out.
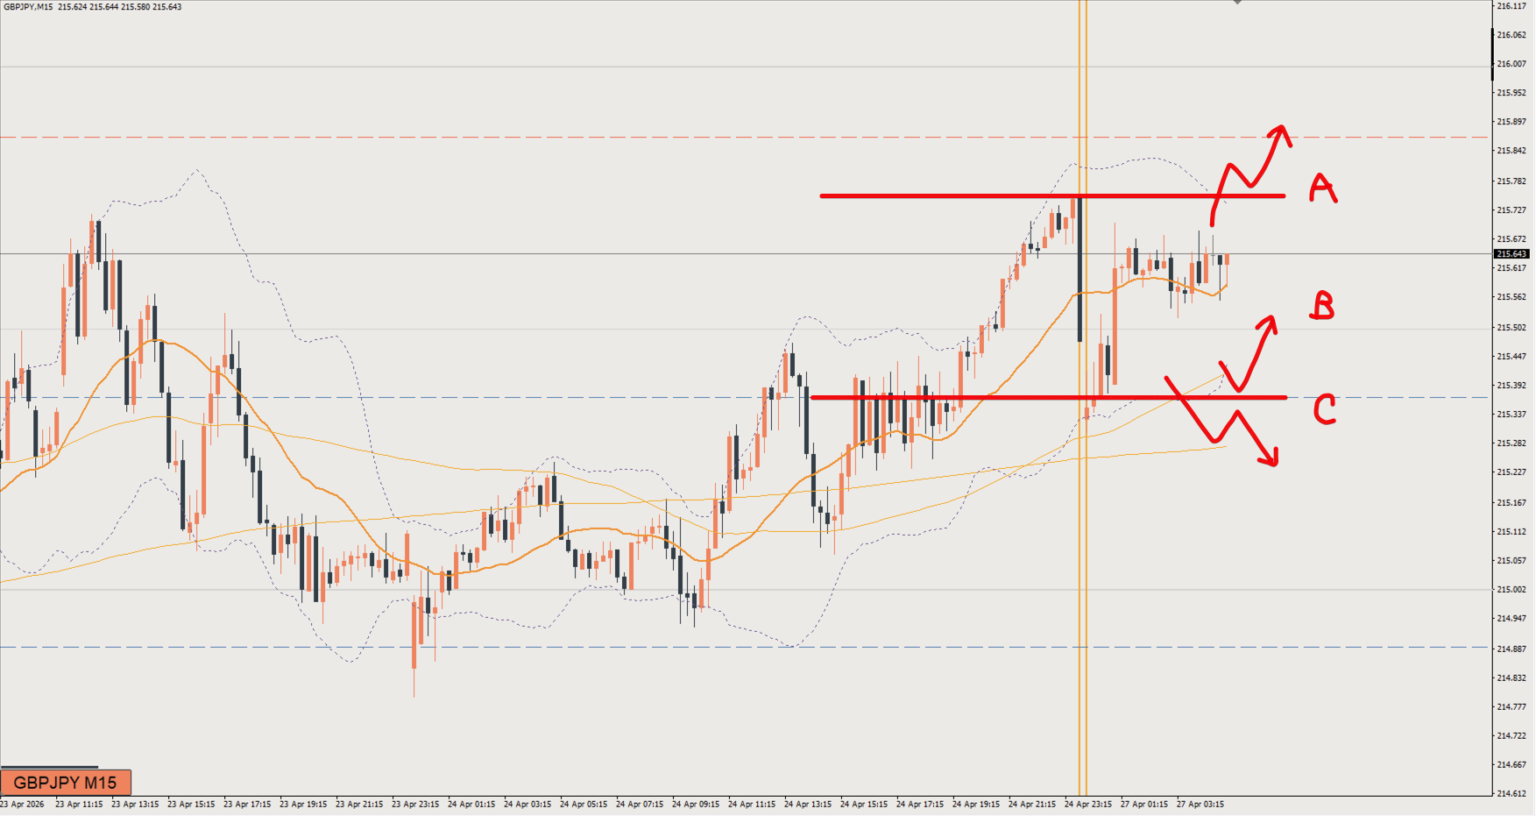
I had been treating the blue line around 215.35 as the range low all along, but after several false breakouts with lower wicks, it has gradually become less clear.Right now I think the range low is around 215.2 (Line C), but the pullback low on the 4-hour chart (H4) is just below that, around 215.That means buyers are likely to step in from around 215, so the sell target is down to that level.