2026/04/17 GBP/JPY Trade Strategy

Today's GBP/JPY call: Sell.
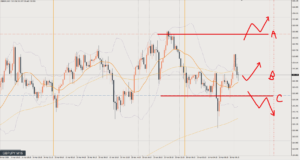
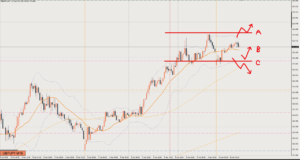
I had been treating the blue line around 215.35 as the range low all along, but after several false breakouts with lower wicks, it has gradually become less clear.
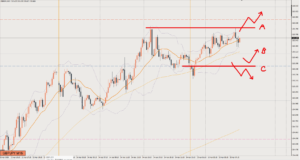
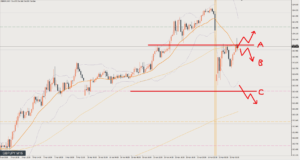
Right now I think the range low is around 215.2 (Line C), but the pullback low on the 4-hour chart (H4) is just below that, around 215.
That means buyers are likely to step in from around 215, so the sell target is down to that level.
If I go short, I’d like to sell from as high as possible.
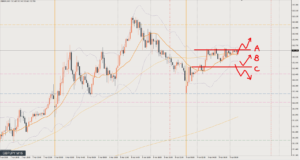
Price is currently forming a short-term upward wave, so it could break through Line A and turn up again, but as long as it doesn’t get above Line A, I want to be selling.
Review

No trade.
After I wrote the scenario, price rose, then dropped again and made a bearish shift, so the change in market context meant I had to rebuild the strategy.
Since it had made a bearish shift, the idea was simply to go short around the red circle.
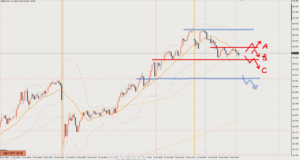
The 1-hour chart (H1) can be seen as ranging within the blue box, so if you go by the bias of the next higher timeframe, selling from around the blue circle is also a valid option.
This article reflects the author's personal view of the market. It does not recommend any specific trade; all investment decisions are your own responsibility.