Estimated pips are the pips that would have been gained by trading ideally along the published scenario.
Currency pair
Total pips
Posts
Average pips
GBP/JPY
+528.0 PIPS
21
25.1 PIPS
USD/JPY
+442.0 PIPS
21
21.0 PIPS
Total
+970.0 PIPS
USD/JPYUSD/JPY
Sell
Buy targetーーー
Sell targetーーー
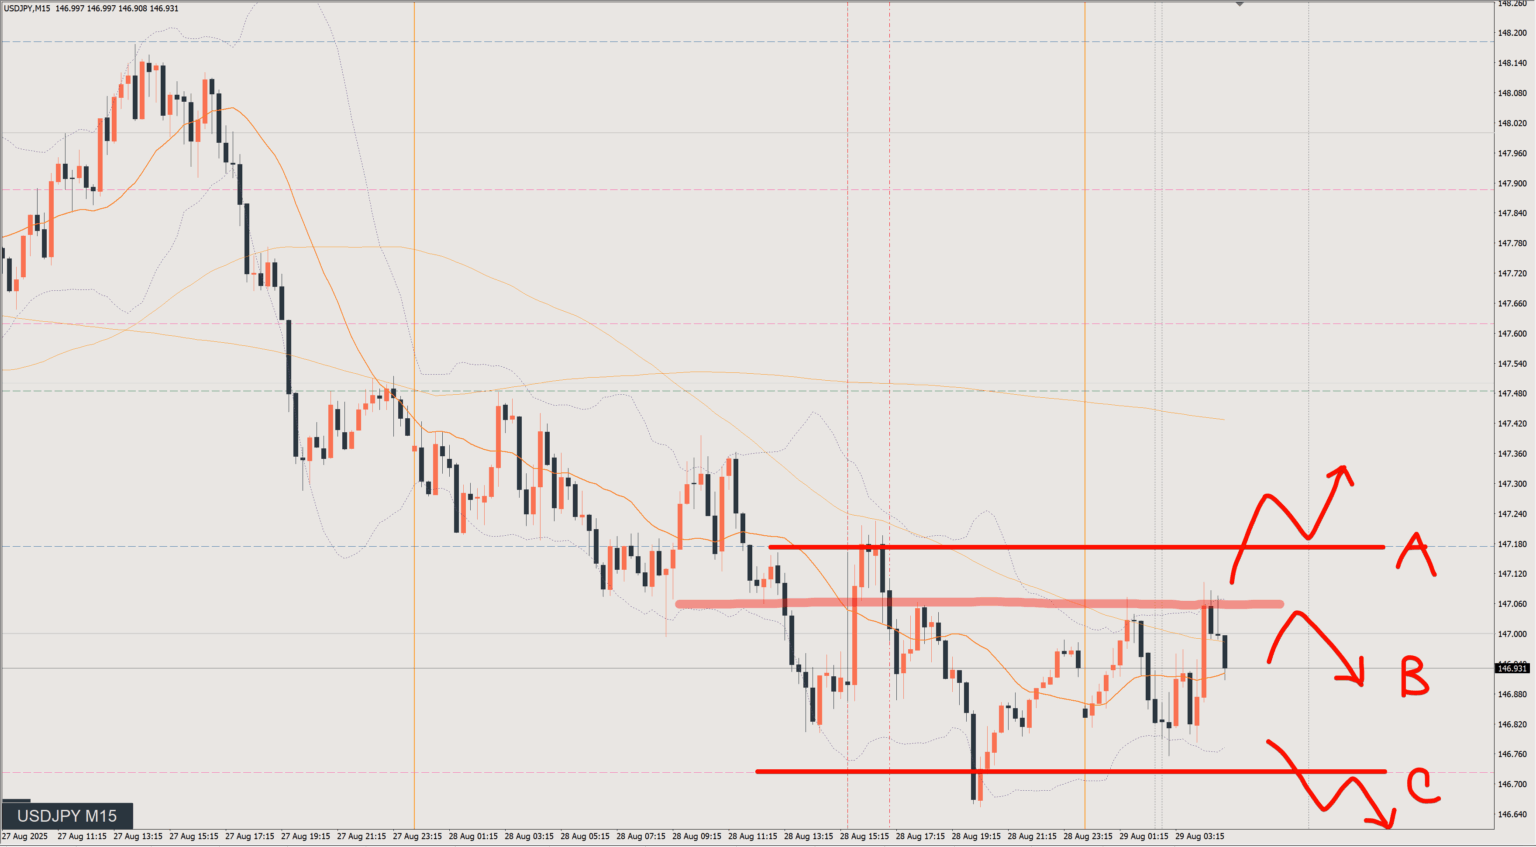
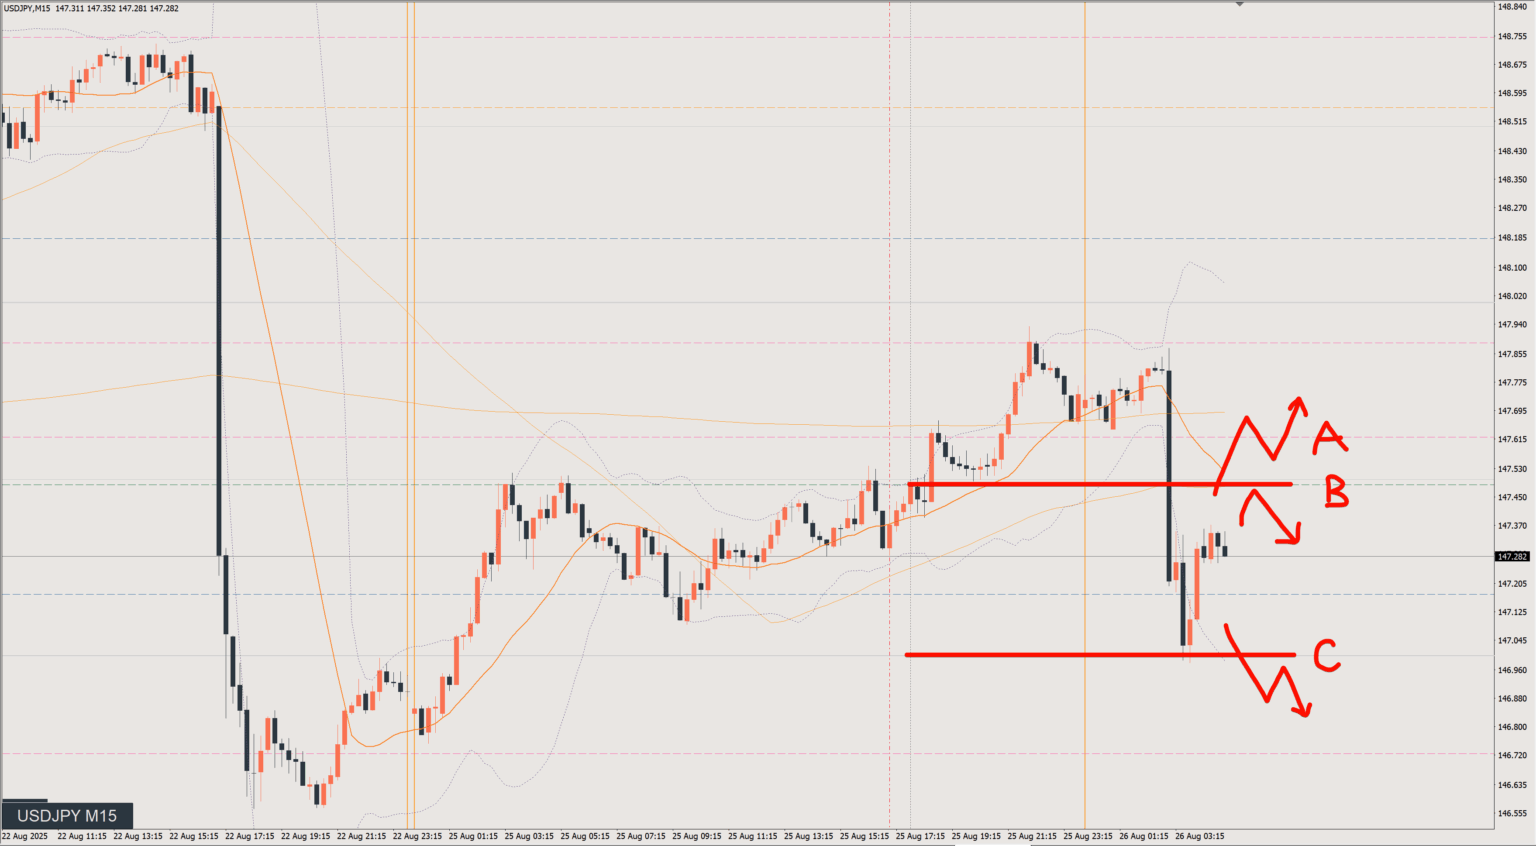
The 4-hour, 1-hour and 15-minute charts are all sells.However, on the 4-hour we need to be wary of being near the lows.It also looks like price is already building a base at the lows on the 15-minute level, so be careful.
For now I'm looking at this from the sell side, but on the 4-hour chart the blue Line C area is roughly the range low, and price is in the process of building a bottom.I need to be careful not to end up selling at the lows.
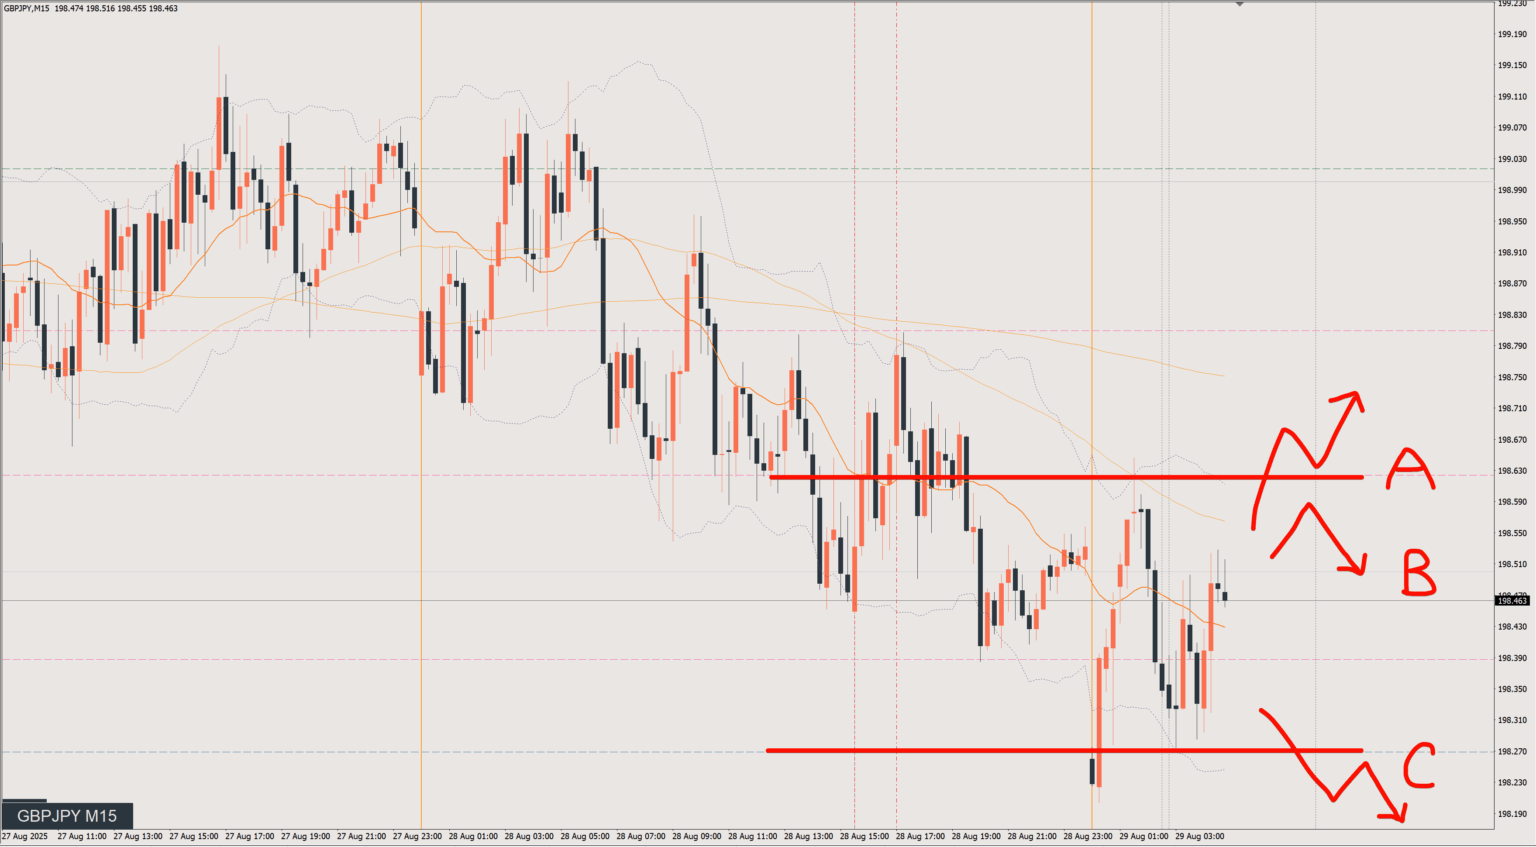
After the big drop on Aug 22, price made a retracement and has now turned back down.That said, nothing has changed on the daily chart, and we're still in a narrow range.No rush. I'll wait for a retracement and look to short.
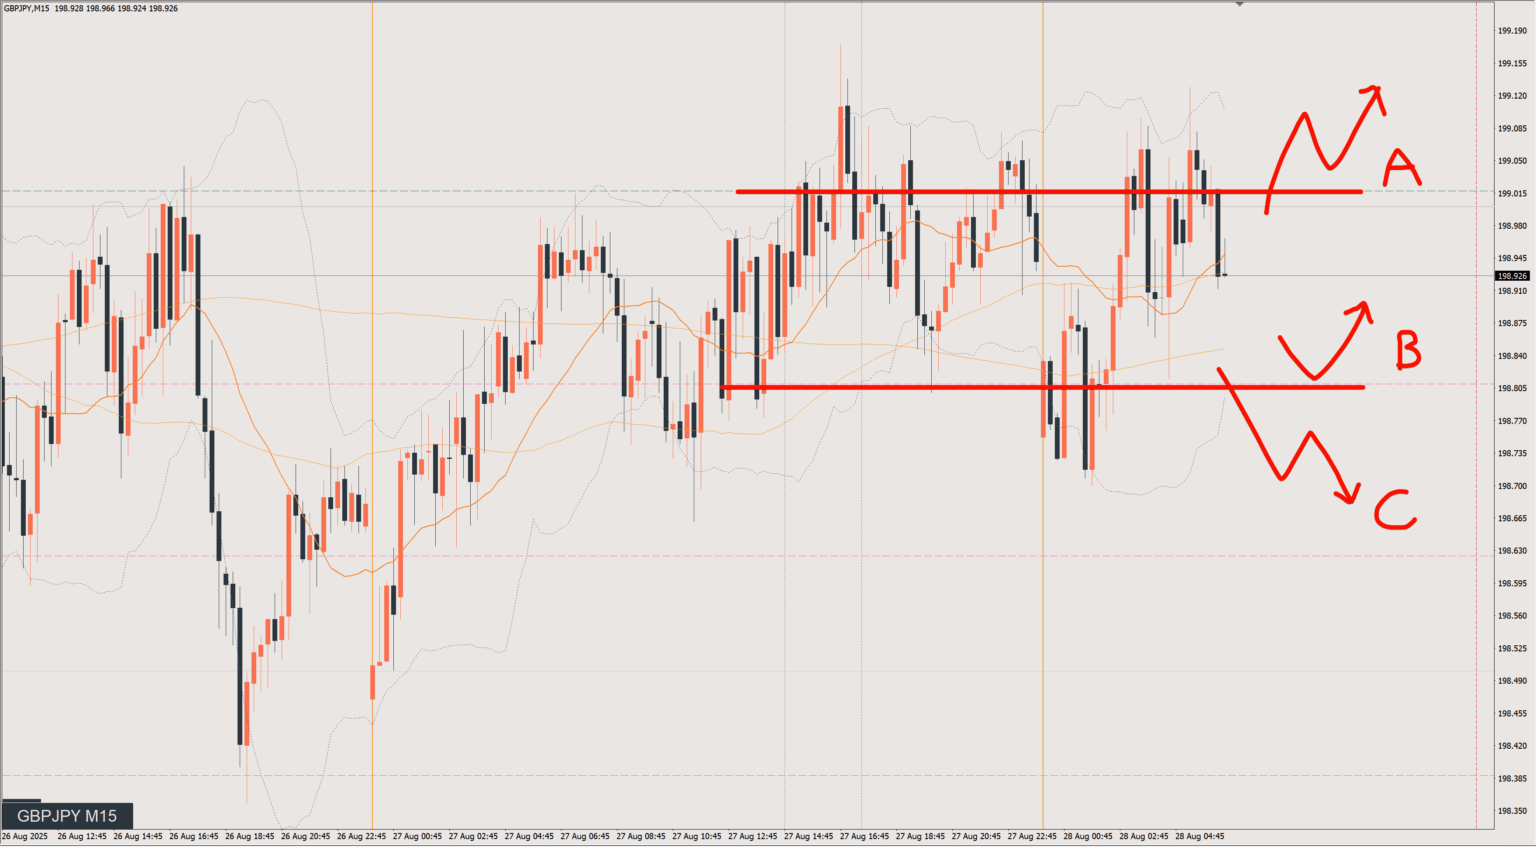
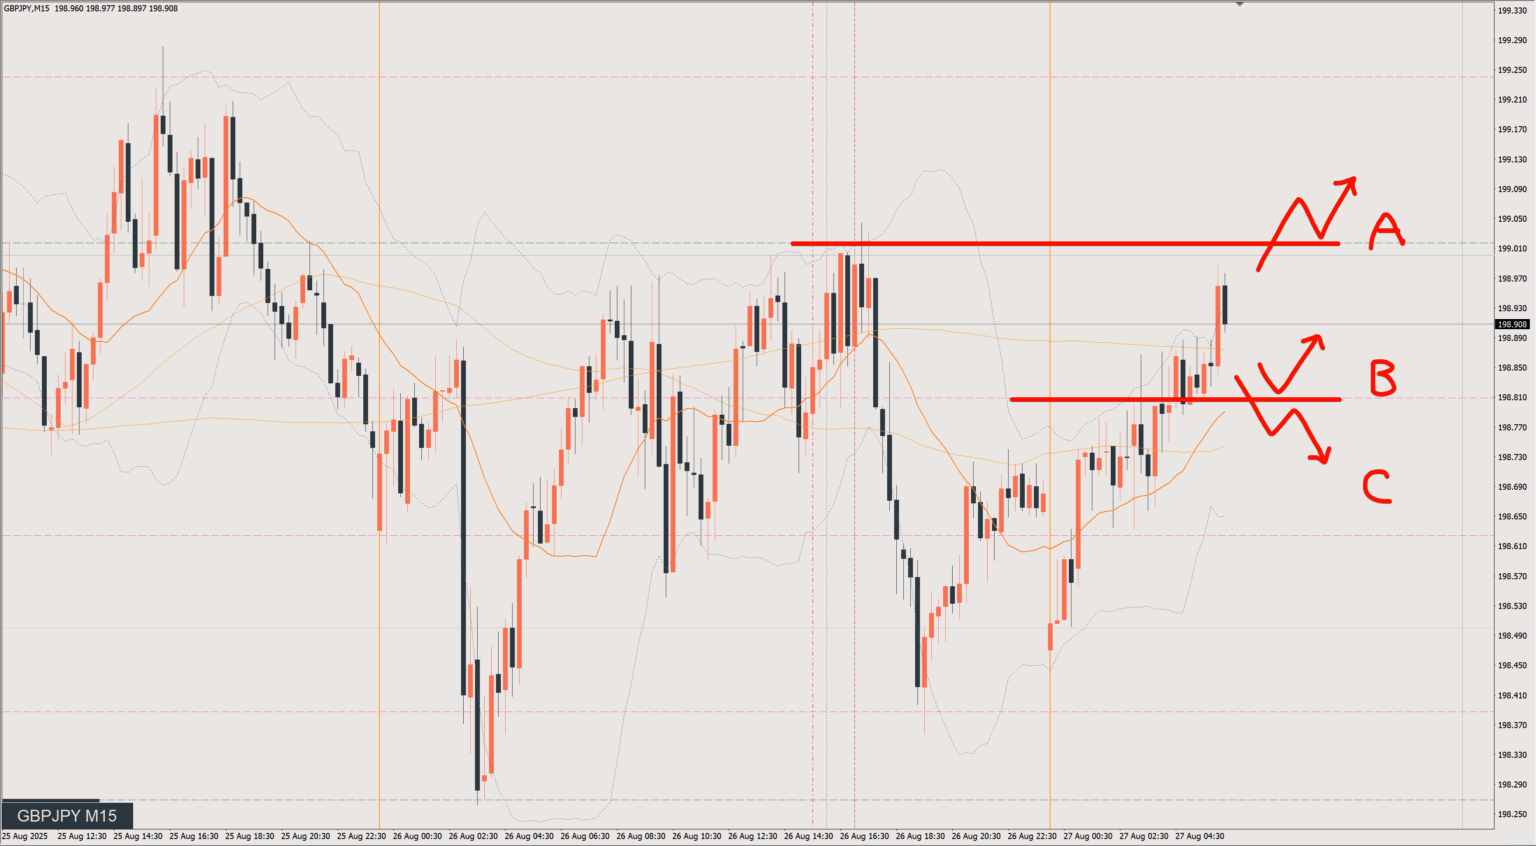
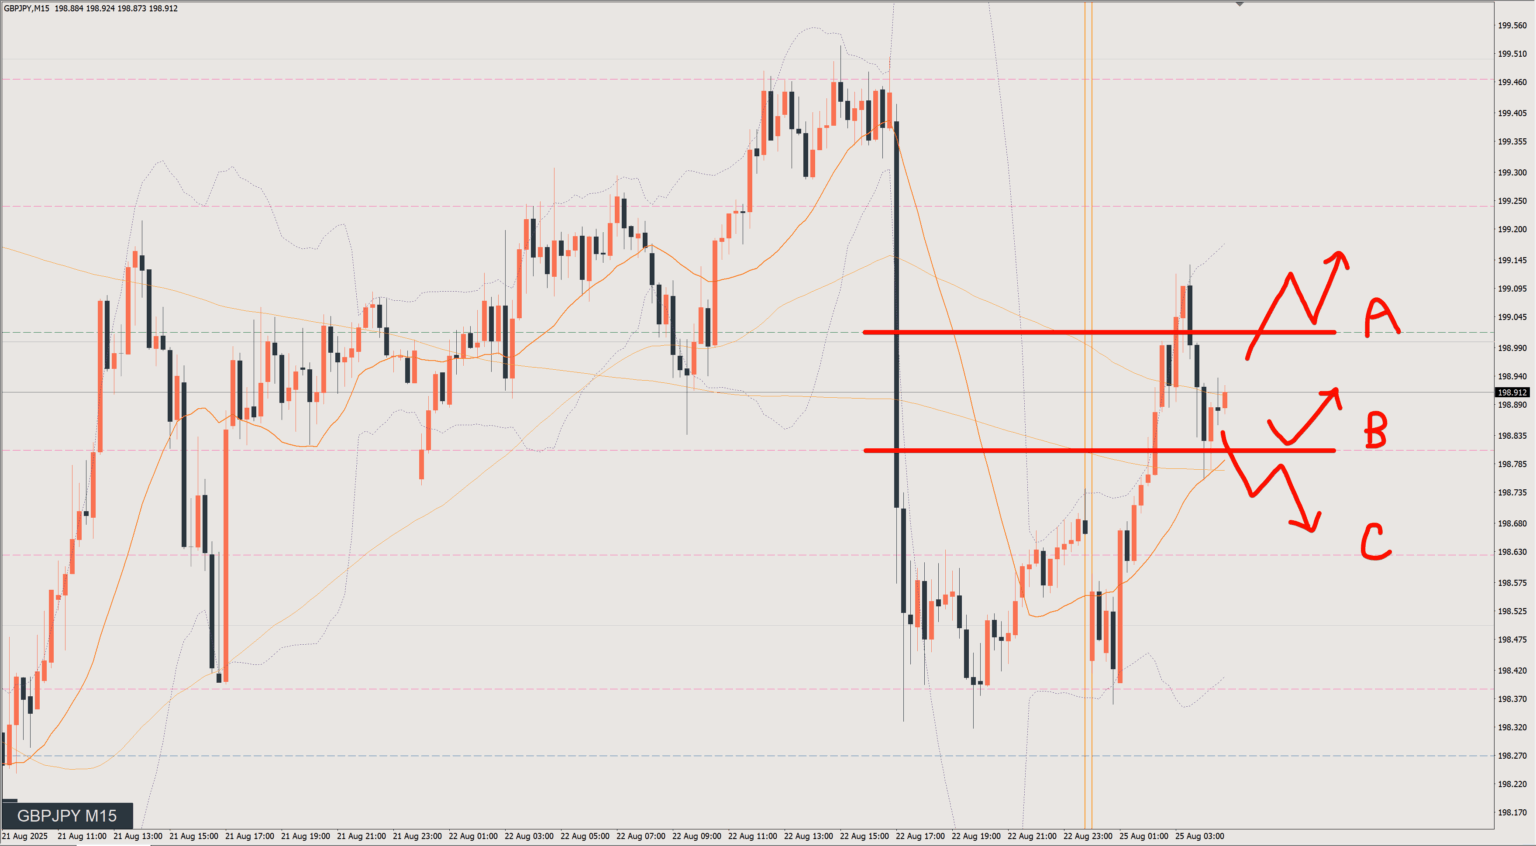
Will it break above 199 or not?It feels like we've been fighting at this level ever since the end of June.For now I'm looking to buy, but I still expect selling pressure from 199.
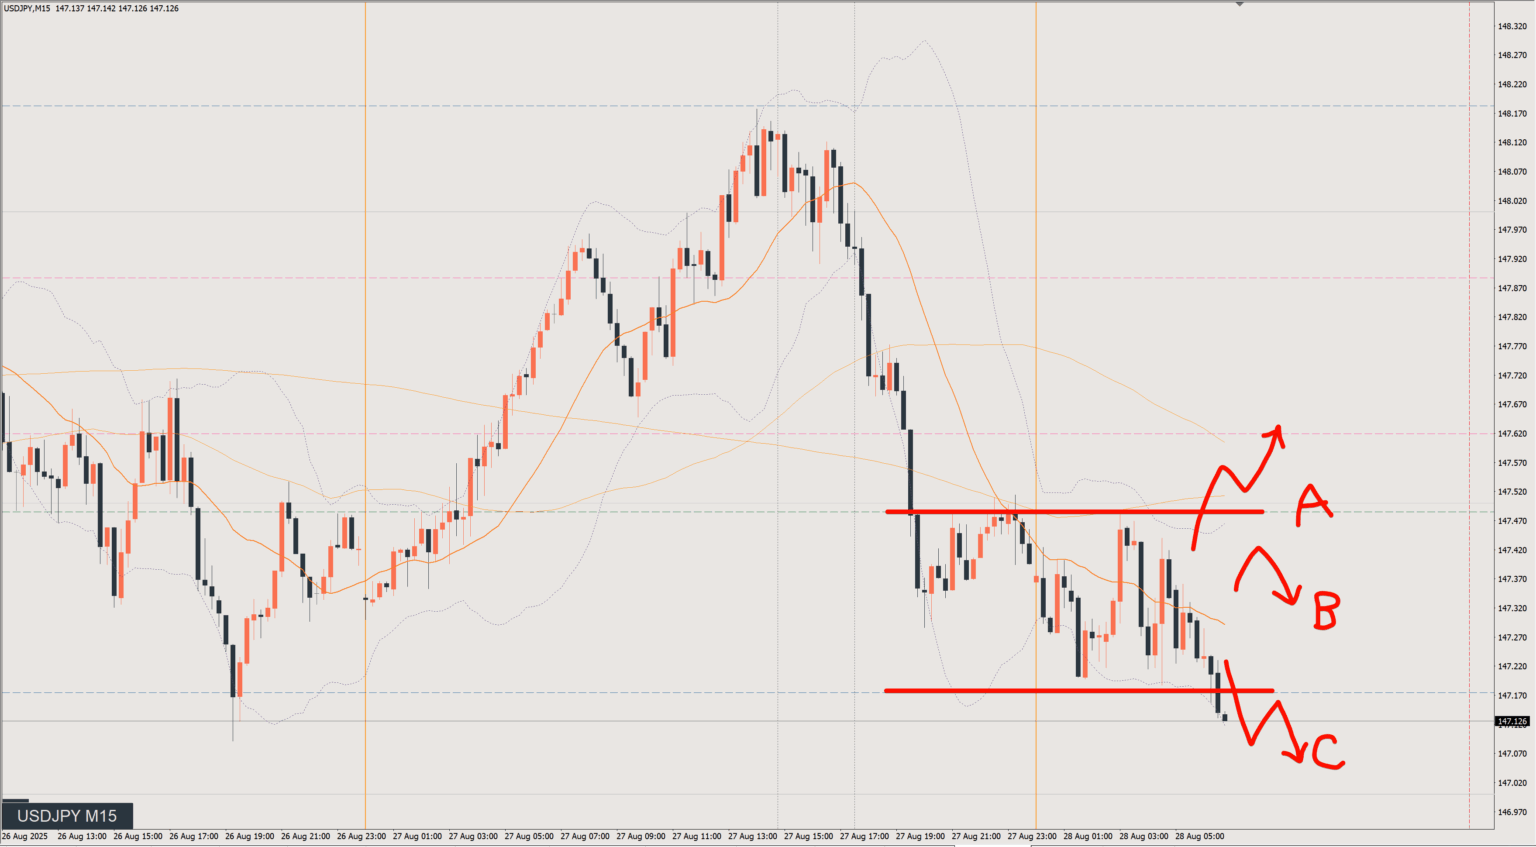
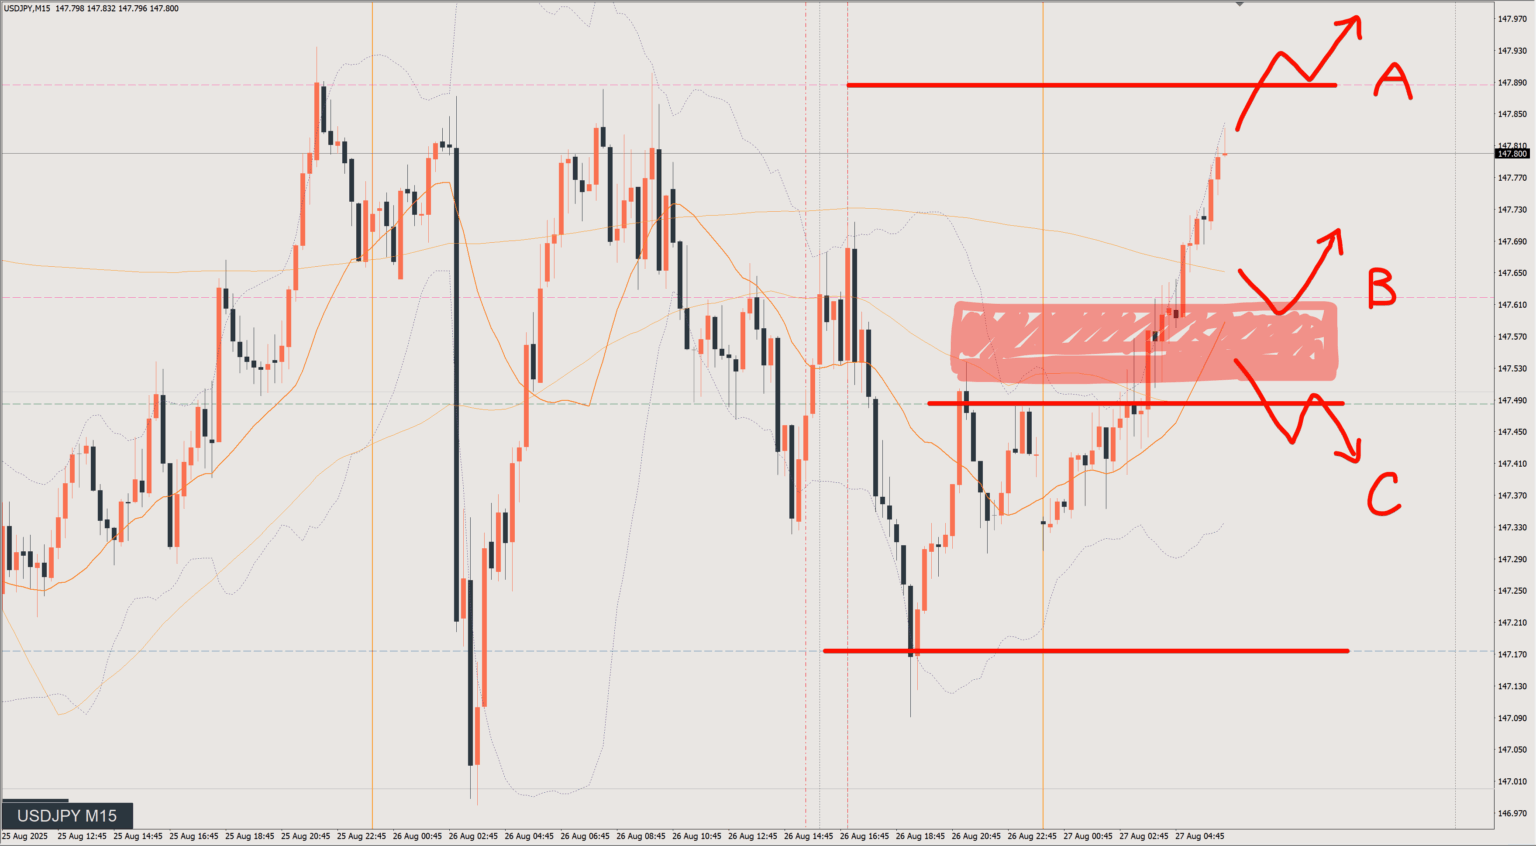
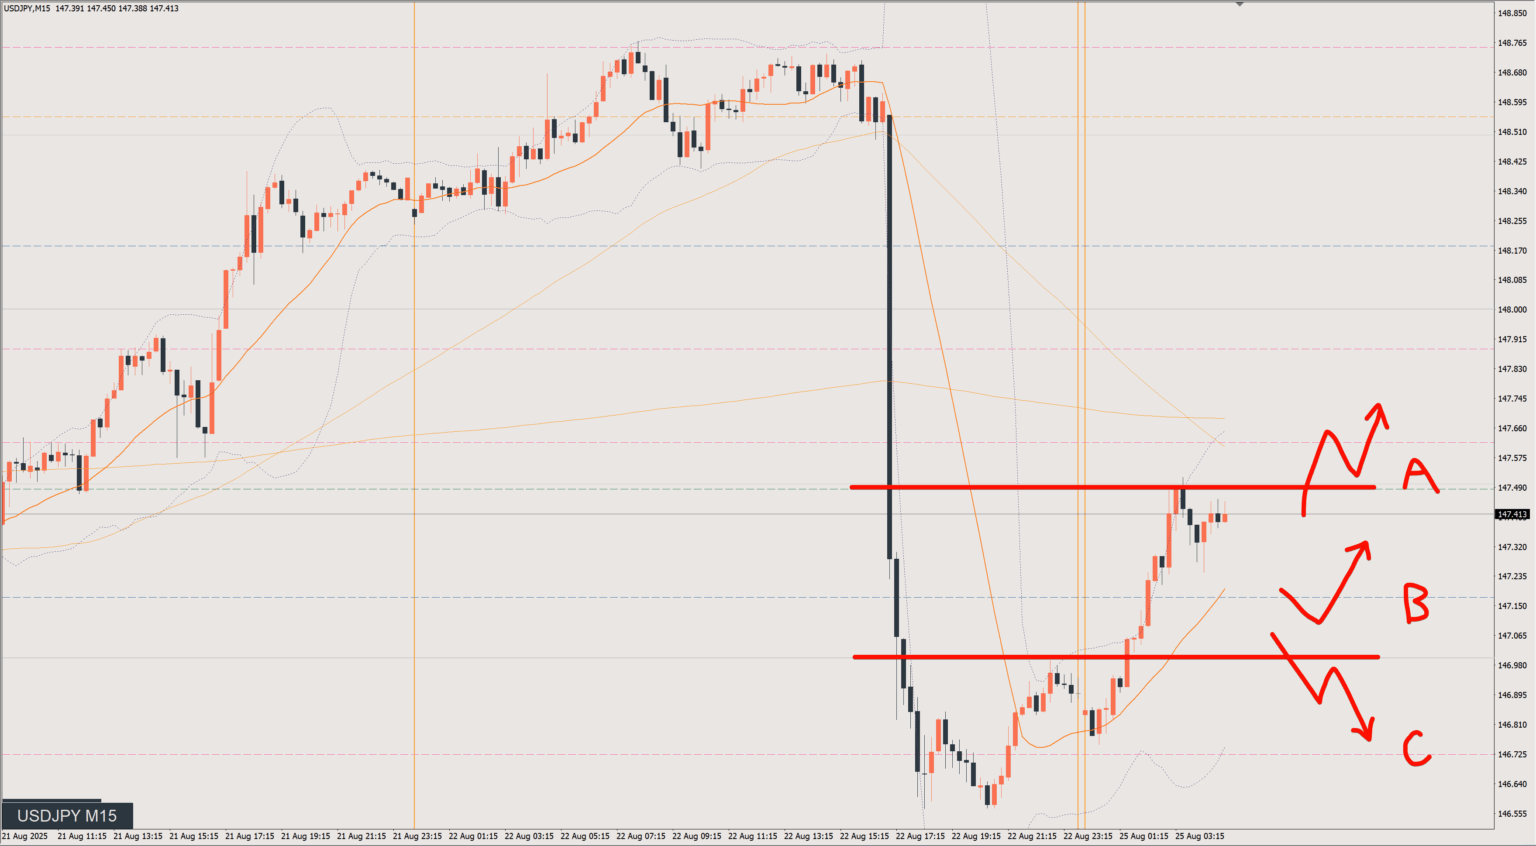
On the bigger picture, we're in a 147.1–147.9 range.Price is currently near the range high, and the question is whether it breaks above it or makes another pullback first.Either way, it's a matter of waiting for the right timing.
On the 15-minute timeframe I'm looking at buying the dip, but on the 1-hour this is a price zone where retracement selling tends to come in.That said, given the situation on the 4-hour and daily charts, I feel an upside break looks fairly likely, so I'm going with a buy strategy.
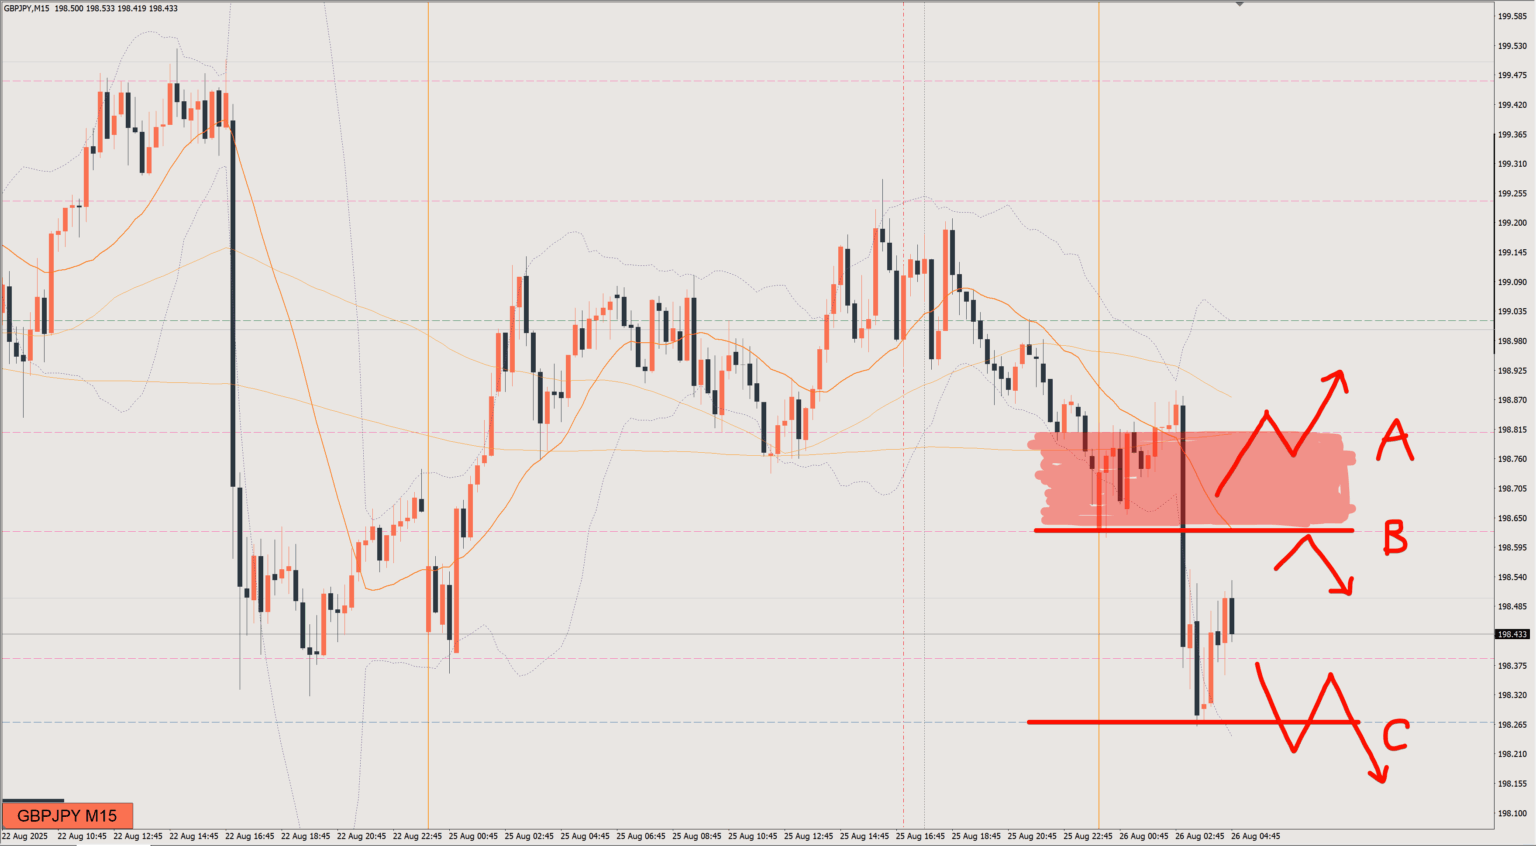
Yesterday was a day of retracement after Friday's big drop.Price is now heading lower again, so this is a spot to look for selling the rally.The daily chart picture hasn't changed since the start of August.
Simply waiting to sell the rally.There isn't much on the buy side, but on the 4-hour chart this is a price zone that acts as a support band.Watch out for a rise after a failed break of the recent low.
For day trading, I have a bullish bias.However, on the 4-hour chart, price is at a level where selling the rally tends to come in.The strategy assumes price dips once and then heads back toward the green line at 147.5.
I'm currently looking to buy, but on the 4-hour chart this is also a spot that could turn into a rally high.On the 1-hour, price has formed a double bottom below and is moving up.Buyers and sellers are both active here, so it's a tricky spot.