Estimated pips are the pips that would have been gained by trading ideally along the published scenario.
Currency pair
Total pips
Posts
Average pips
GBP/JPY
+814.0 PIPS
18
45.2 PIPS
USD/JPY
+434.0 PIPS
17
25.5 PIPS
Total
+1,248.0 PIPS
USD/JPYUSD/JPY
Buy
Buy target159.9, then 160.4 if it breaks above
Sell target159.1–2
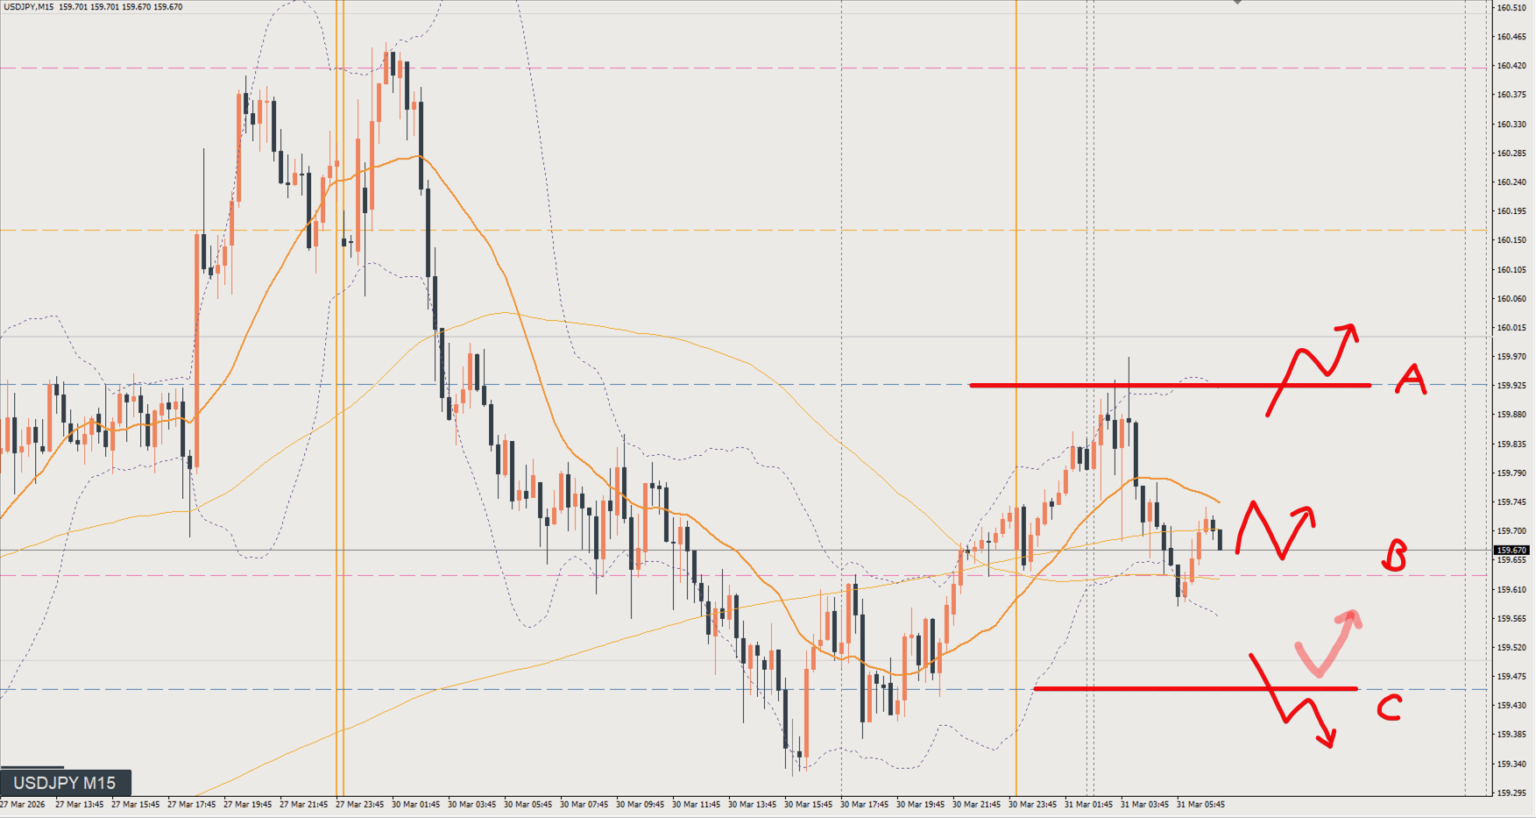
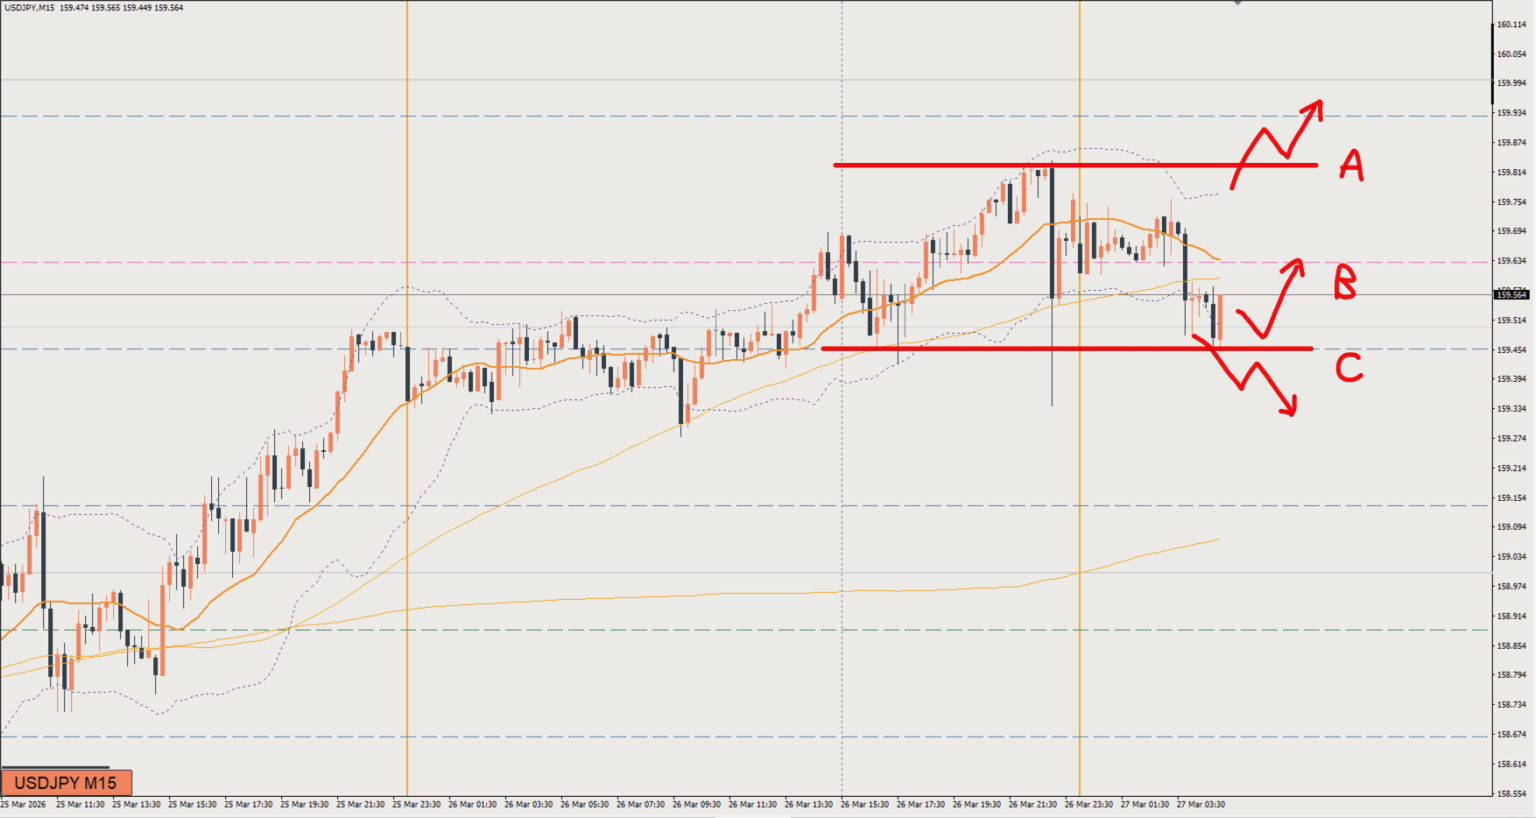
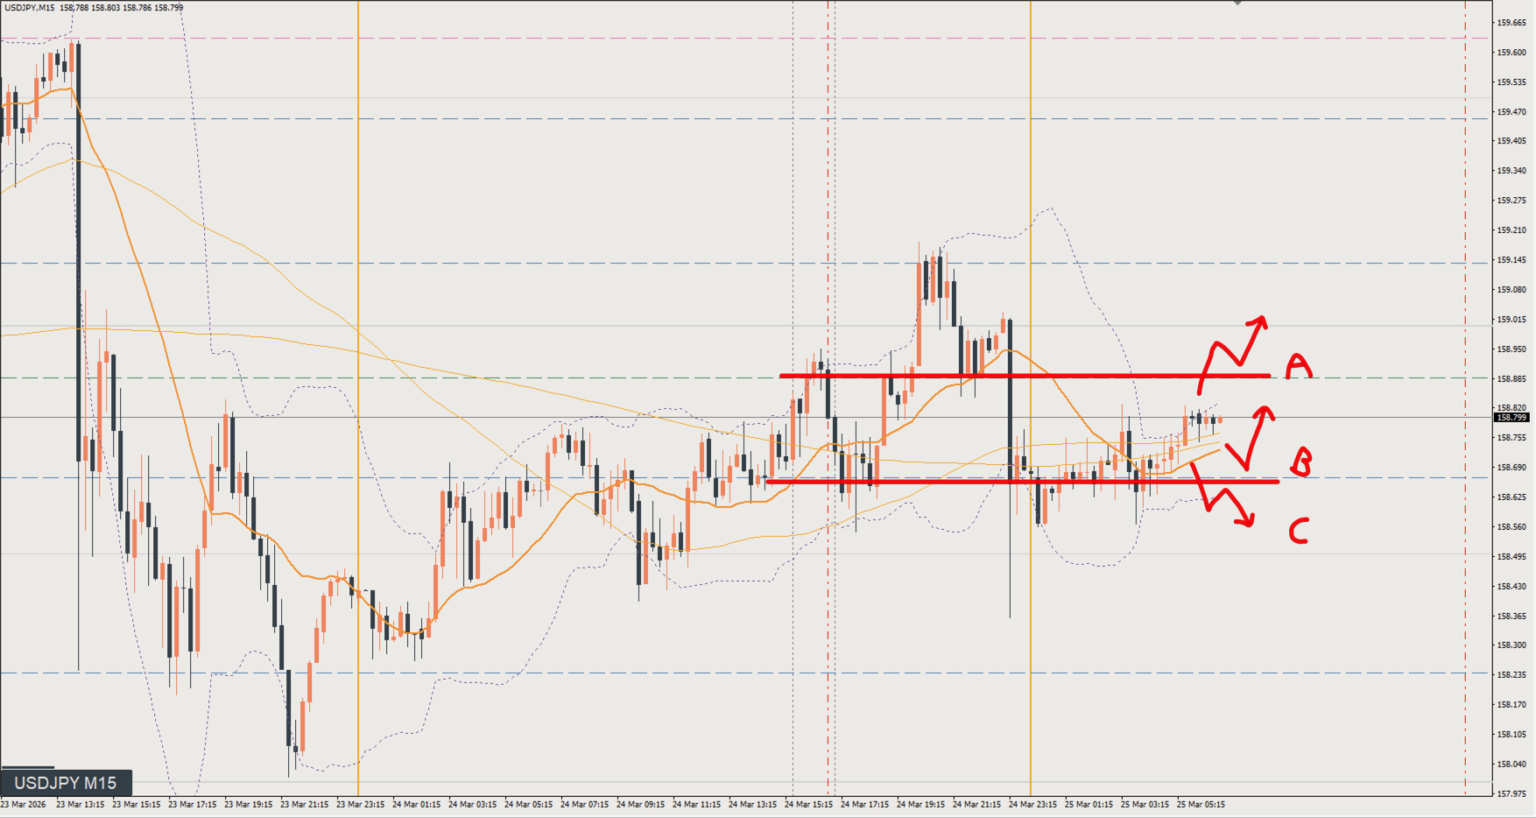
Price dropped yesterday, falling from near the highs on the daily chart, but it seems to be just barely holding on around the 4-hour pullback low.From a day-trading perspective, this is a somewhat tricky situation.My bias is to buy, but on the 15-minute chart (M15) level, selling is also a valid option.
The bigger trend is down, but price is currently in a retracement higher.I expect a daily chart-level retracement to form, so for day trading I'm looking to buy.I want to buy after seeing whether price bounces from around current levels or drops to around Line C before bouncing.
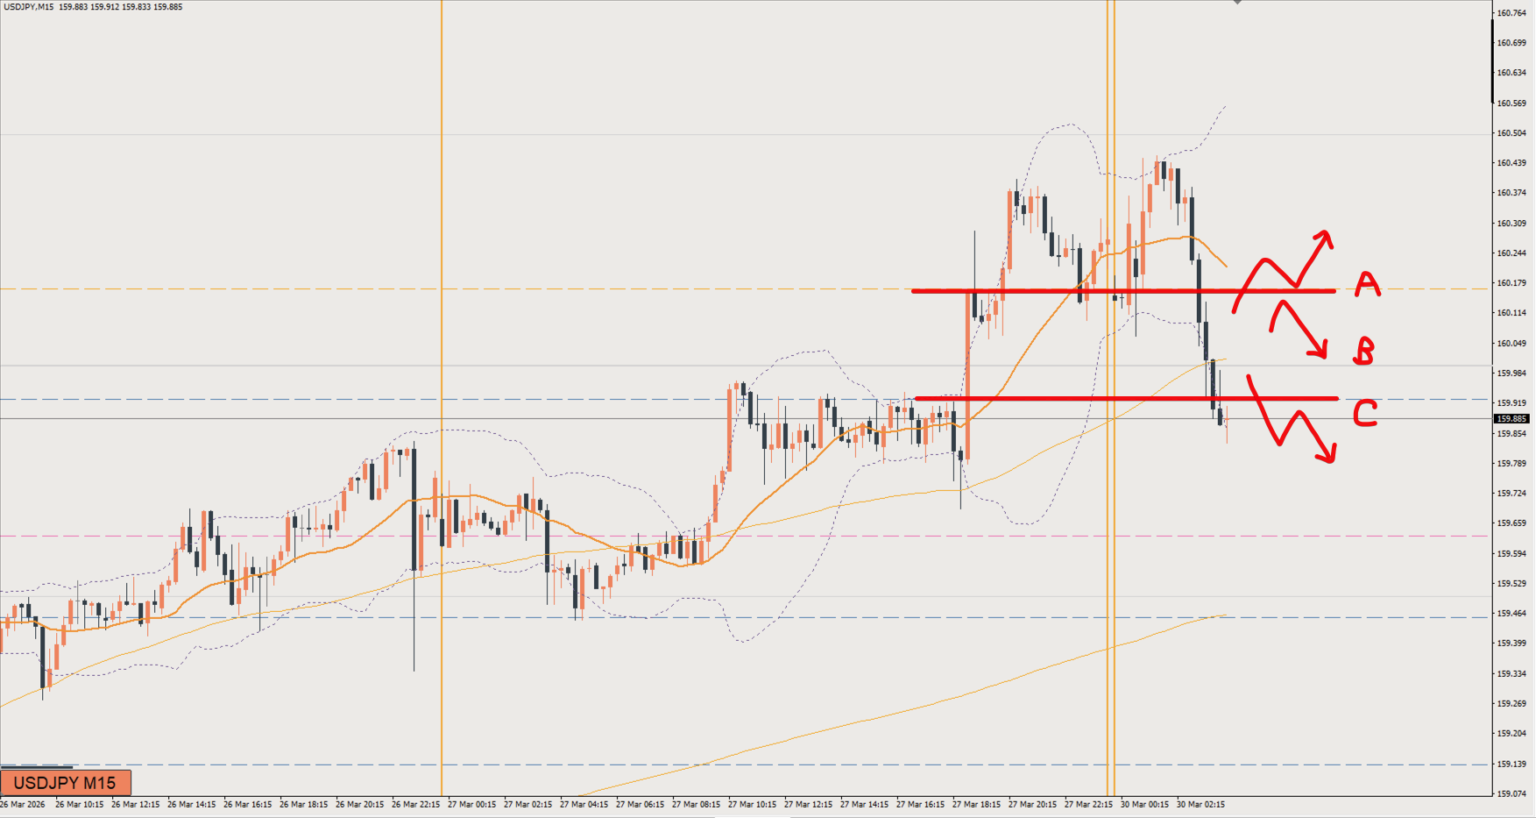
The week started with price having broken above the recent high on the daily chart, but it has since dropped and I currently have a bearish bias.On the 1-hour and 4-hour charts, this is a price zone that could turn into a pullback, so will it rise from here once, or keep falling?Either way, I'm going in with a bearish bias.
On Friday, price failed to break above the daily chart high and has started to fall.On the 4-hour chart (H4) as well, it's fair to see this as a sell setup.From here, I'll be waiting for a retracement to go short, and I picture price forming a retracement somewhere between around Line B and Line A before dropping.Even if it keeps falling from here, I'll still be waiting for a retracement, but the retracement high area might shift a little lower.
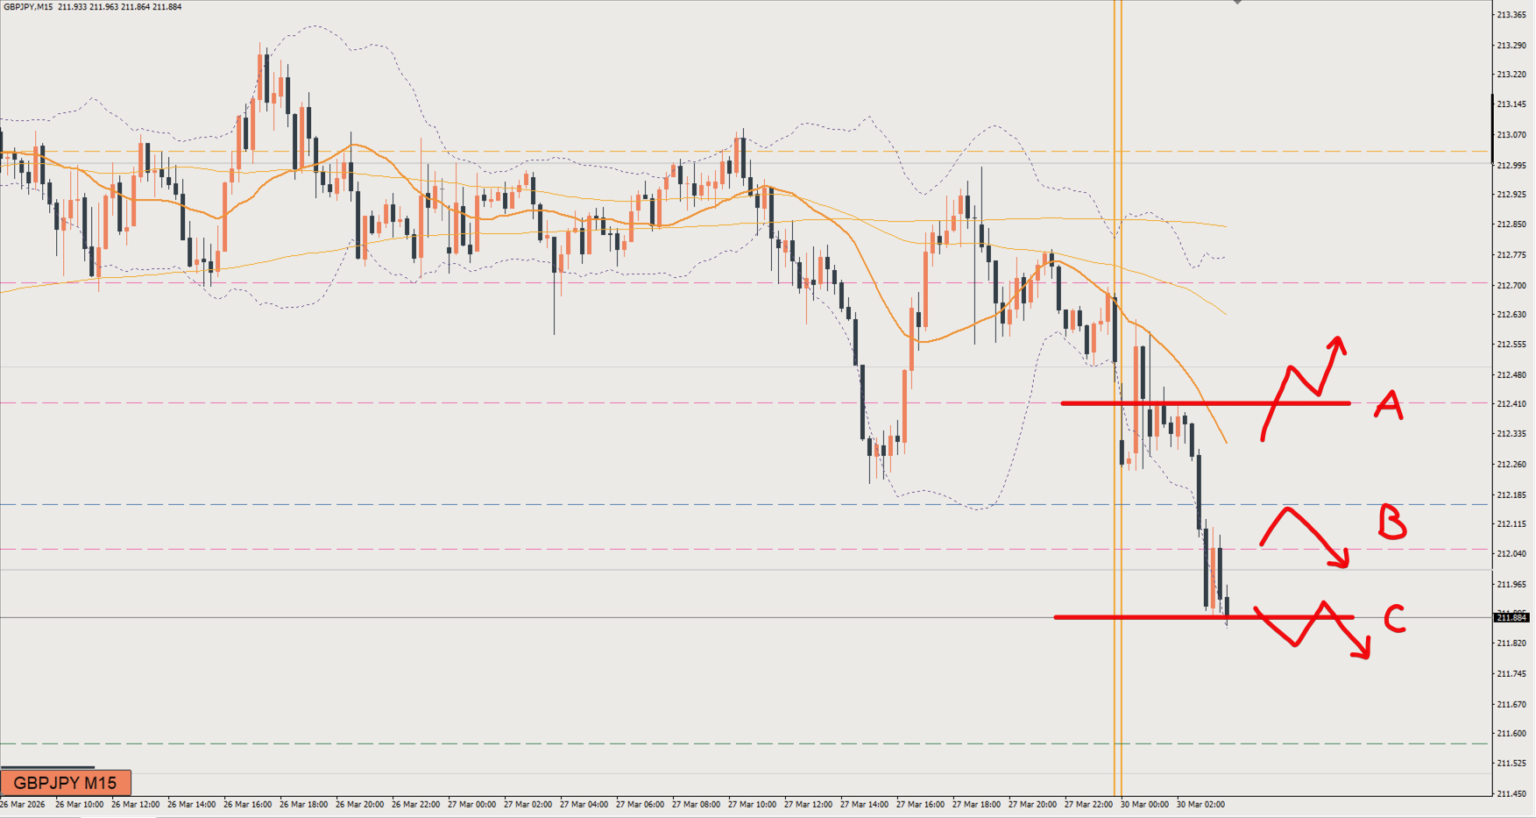
The daily chart is near the highs, and the 4-hour chart has broken above its recent high but is likewise near the highs.If price rises, this looks like a price zone that could be a pullback candidate, but in the short term we have a bearish shift.
Buy target213.2, and if it breaks above, a rise to 214.3?
Sell target212.2
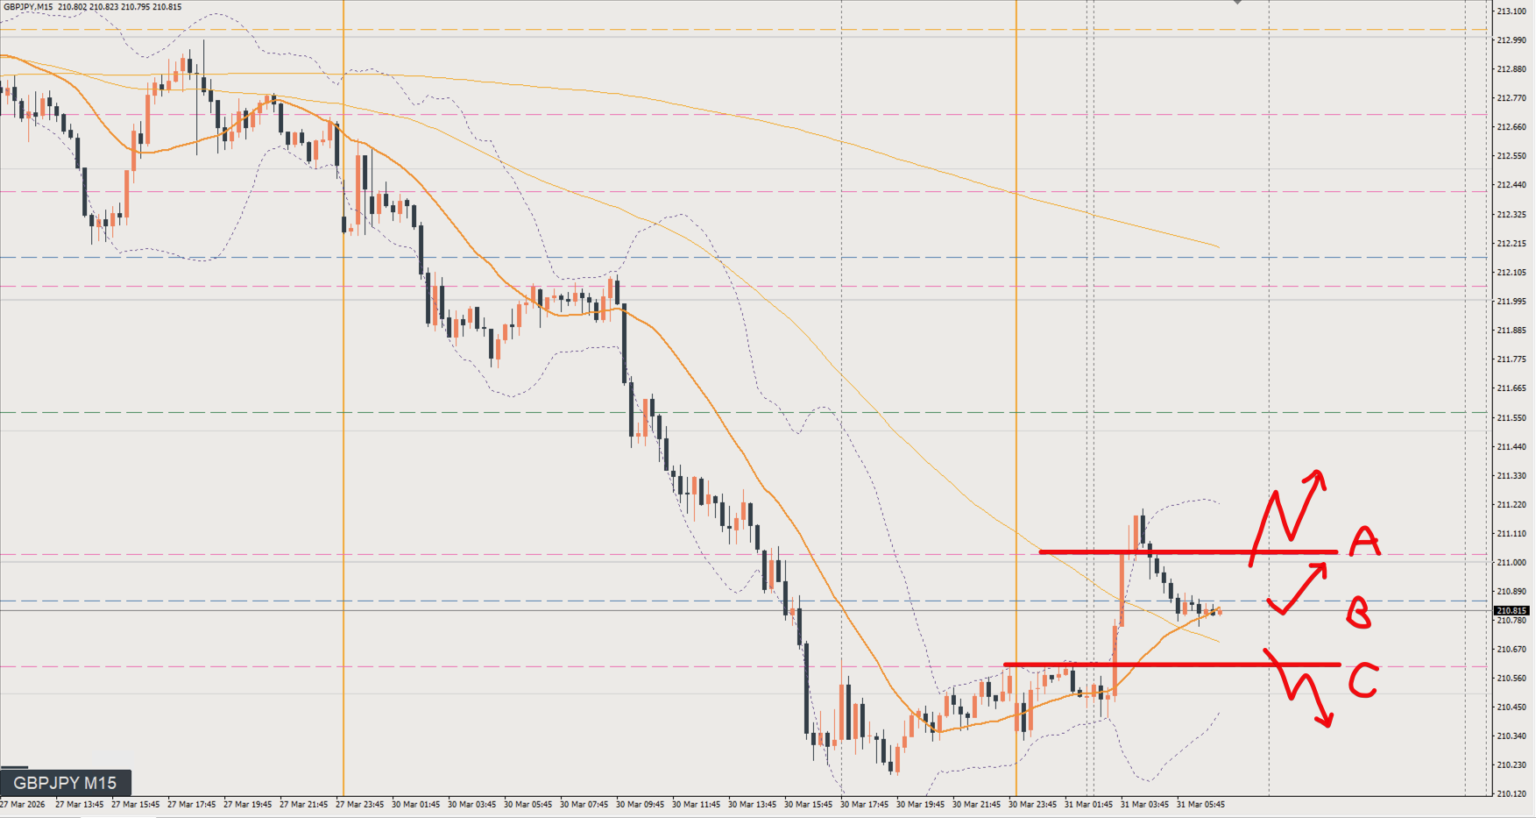
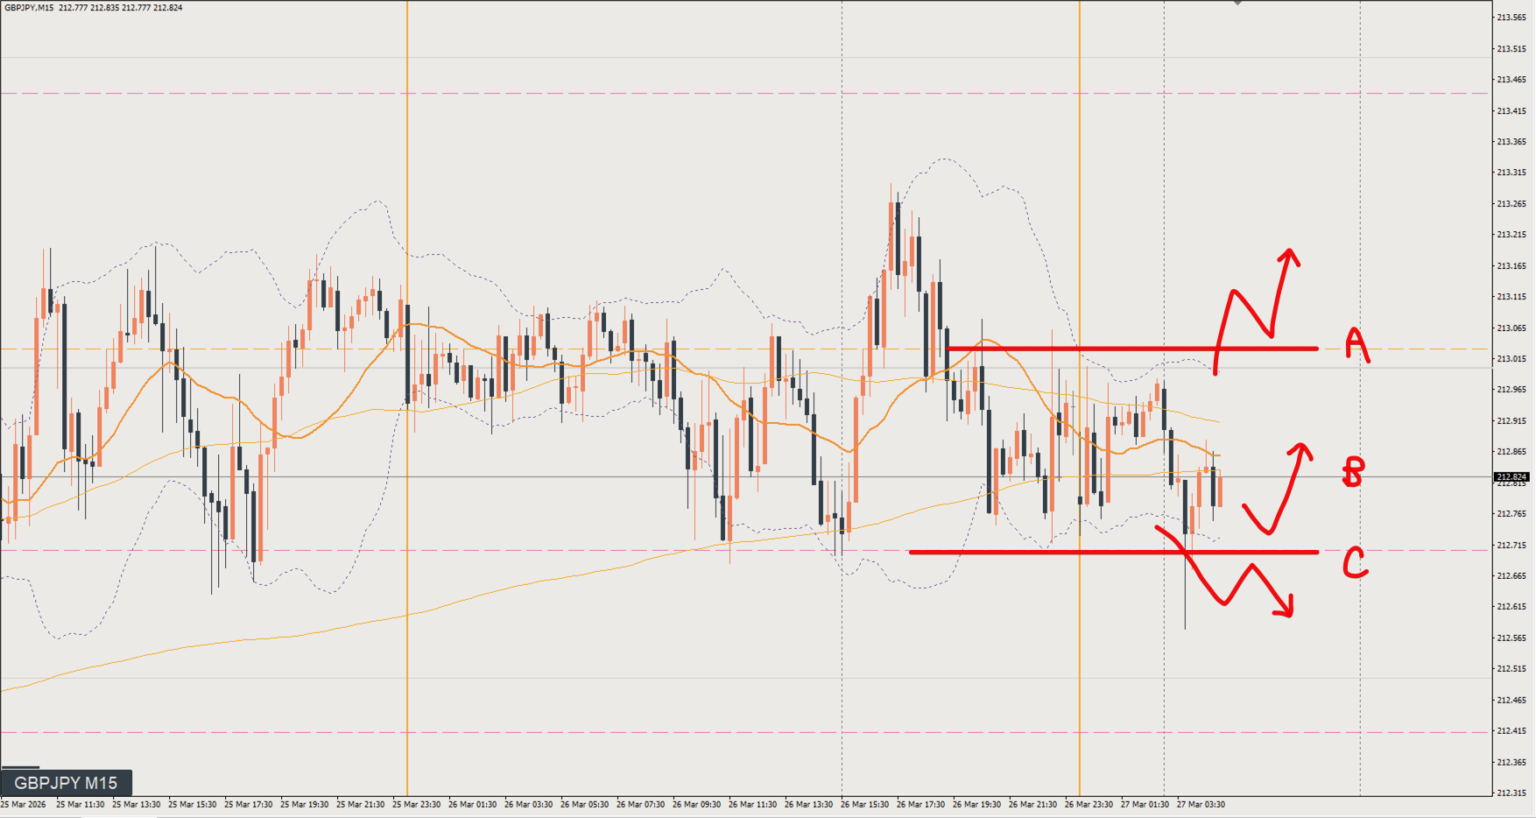
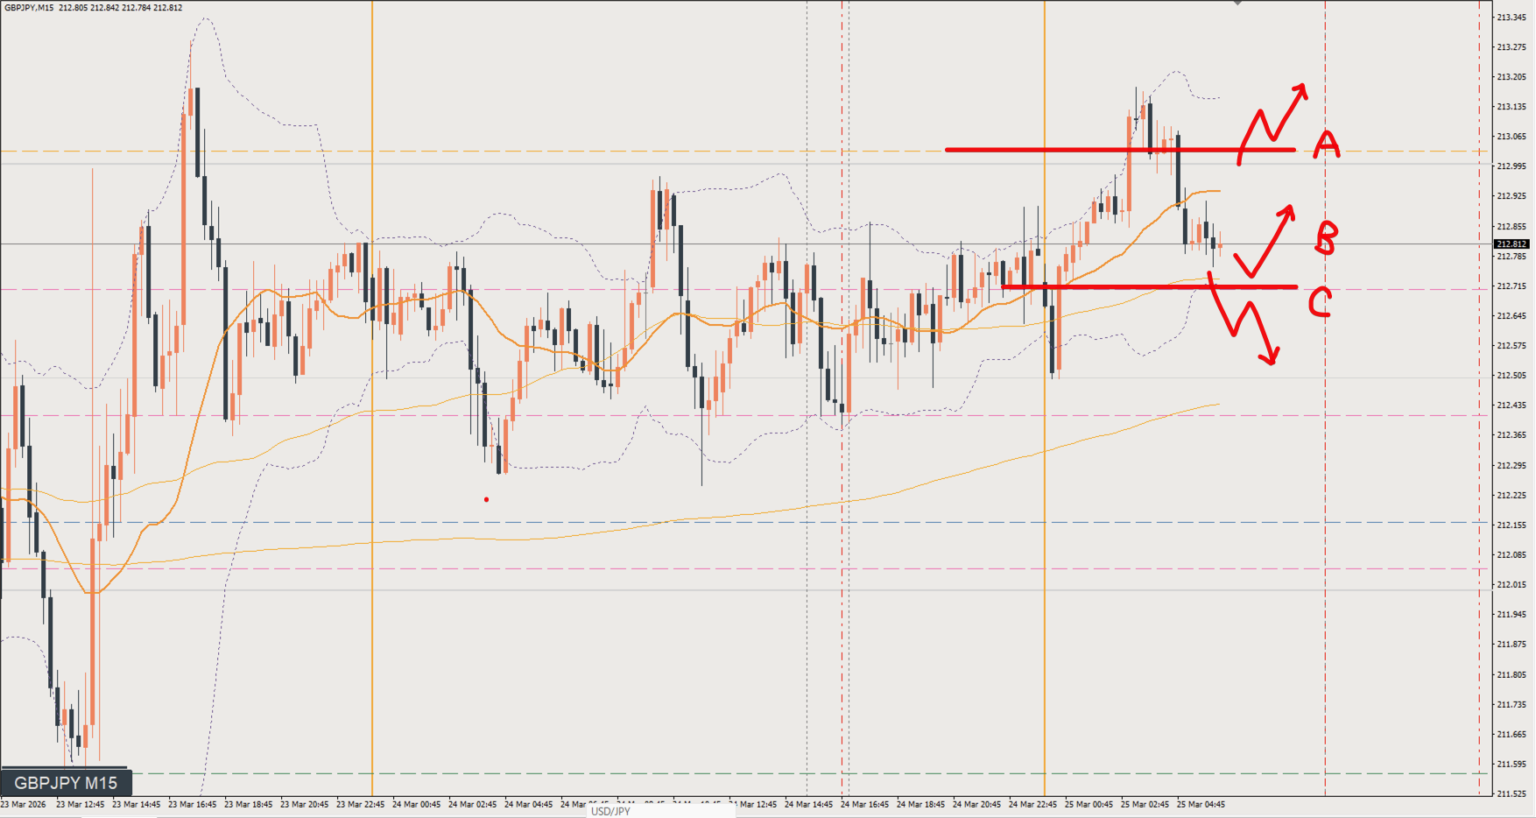
Price is still near the highs, but signs of a drop are starting to appear.For now I still have a bullish bias, but if price breaks below the range here, it's a sell.
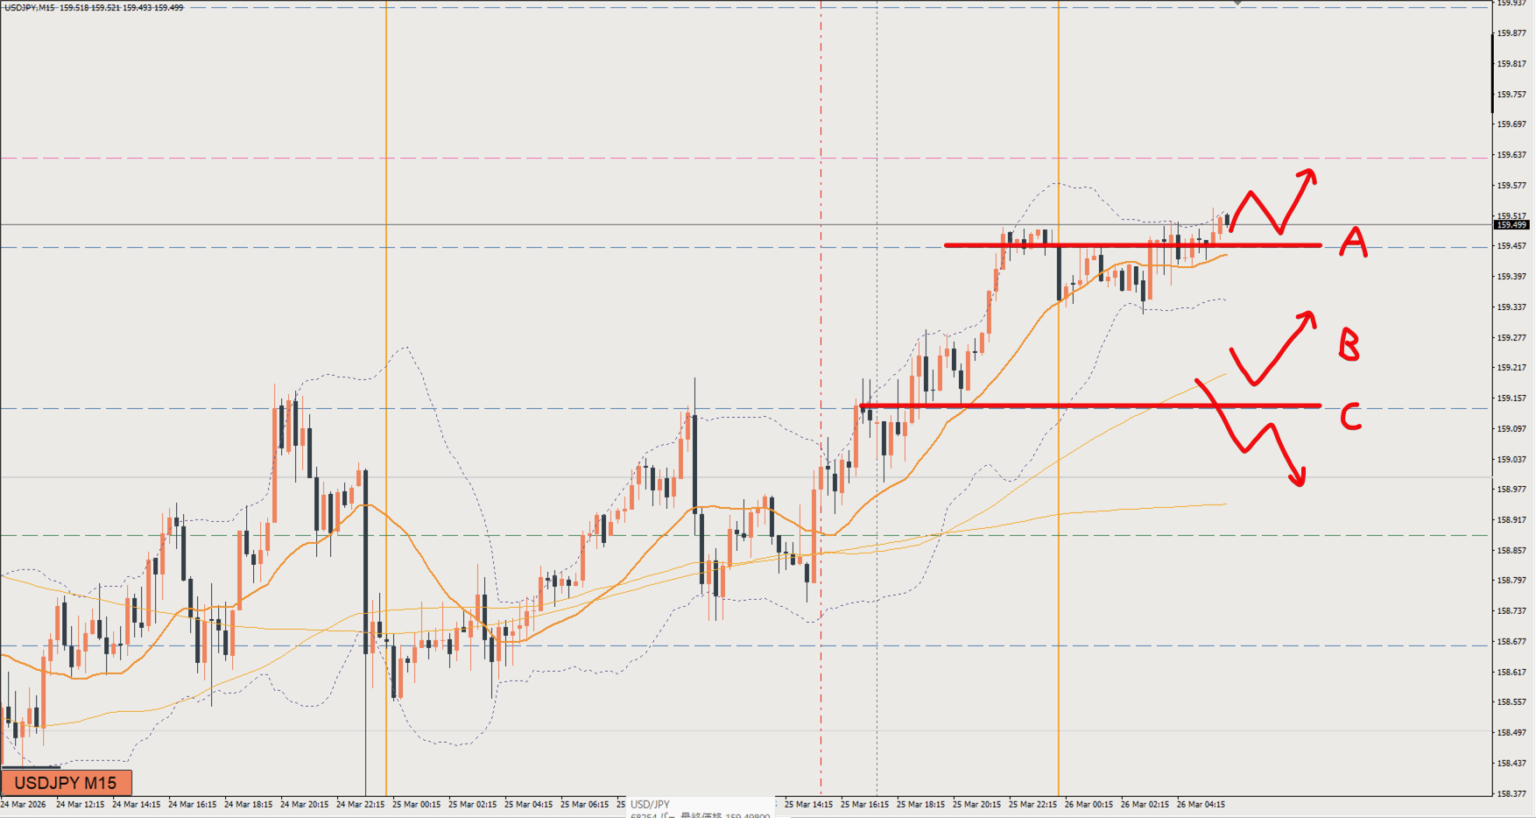
Price broke to the upside last night, so right now it's a buy.However, this price is a key level on the 4-hour chart, so the movement has slowed down.It's rising and I have a bullish bias, but this is a situation where I should wait patiently before buying.I think it'll be easier to buy if it drops to around the C line.
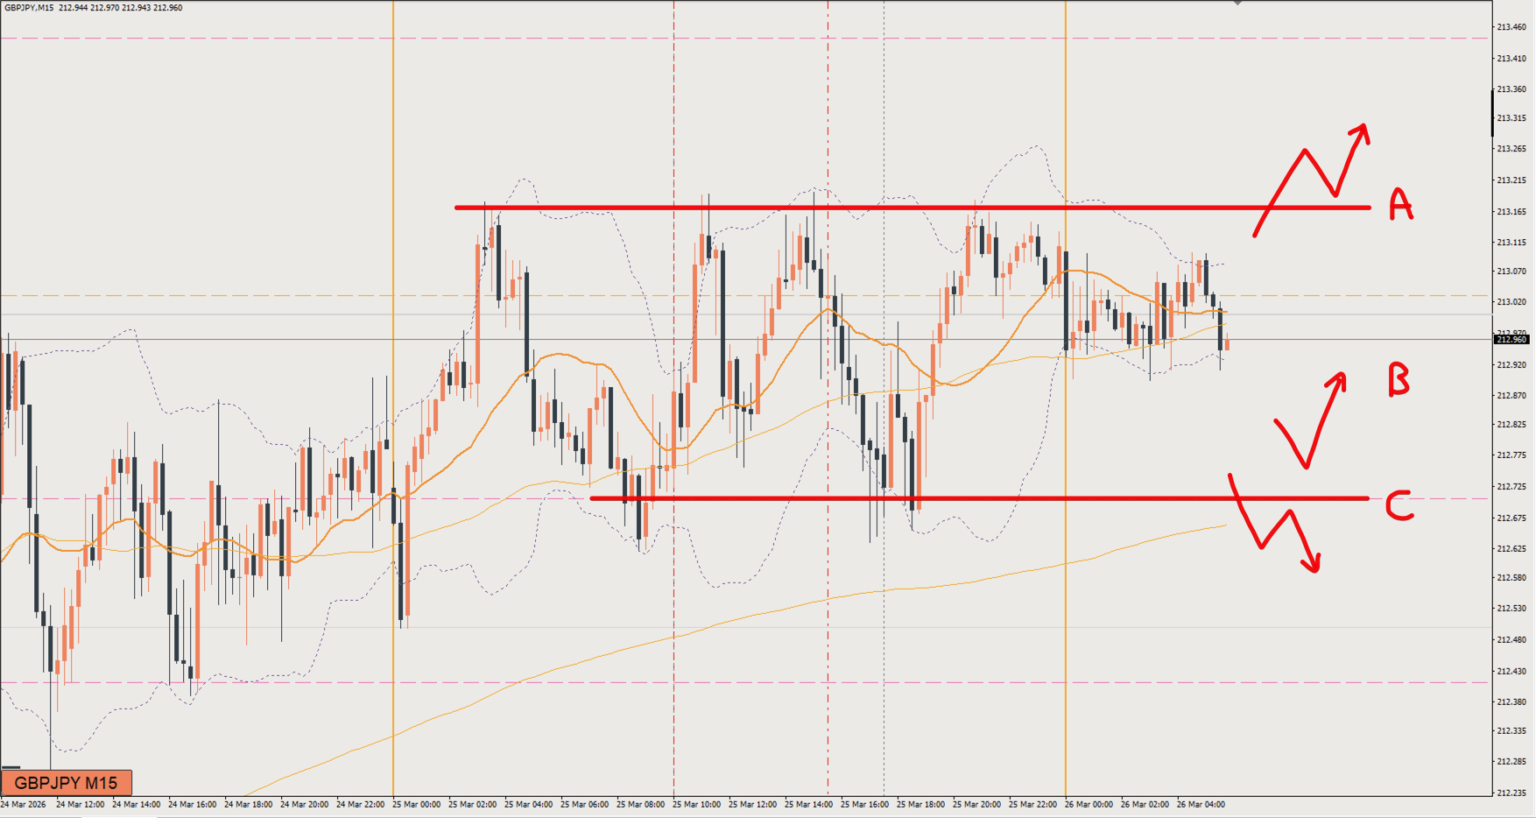
Price is still near the highs, which makes it tough to trade.Since it's a range, the basic approach is to wait for the range low. Jumping in at a half-hearted level will only cause pain, so I want to wait for the right timing.
I have a bullish bias, but it's not a market I feel like trading aggressively.I see the 4-hour chart (H4) as a sell, but the 1-hour chart (H1) looks like it might be a buy.Price could aim for the high once more on the 1-hour chart (H1), but I can also see it forming a double top and then dropping.
After taking its time to form a pullback, the price is now turning into an upward move.The daily chart and 4-hour chart are still near the highs, so caution is needed.If it can't break above the yellow line around 213, I think it could start losing momentum from here and move lower.