Estimated pips are the pips that would have been gained by trading ideally along the published scenario.
Currency pair
Total pips
Posts
Average pips
GBP/JPY
+806.0 PIPS
18
44.8 PIPS
USD/JPY
+635.0 PIPS
18
35.3 PIPS
Total
+1,441.0 PIPS
USD/JPYUSD/JPY
Sell
Buy targetーーー
Sell targetーーー
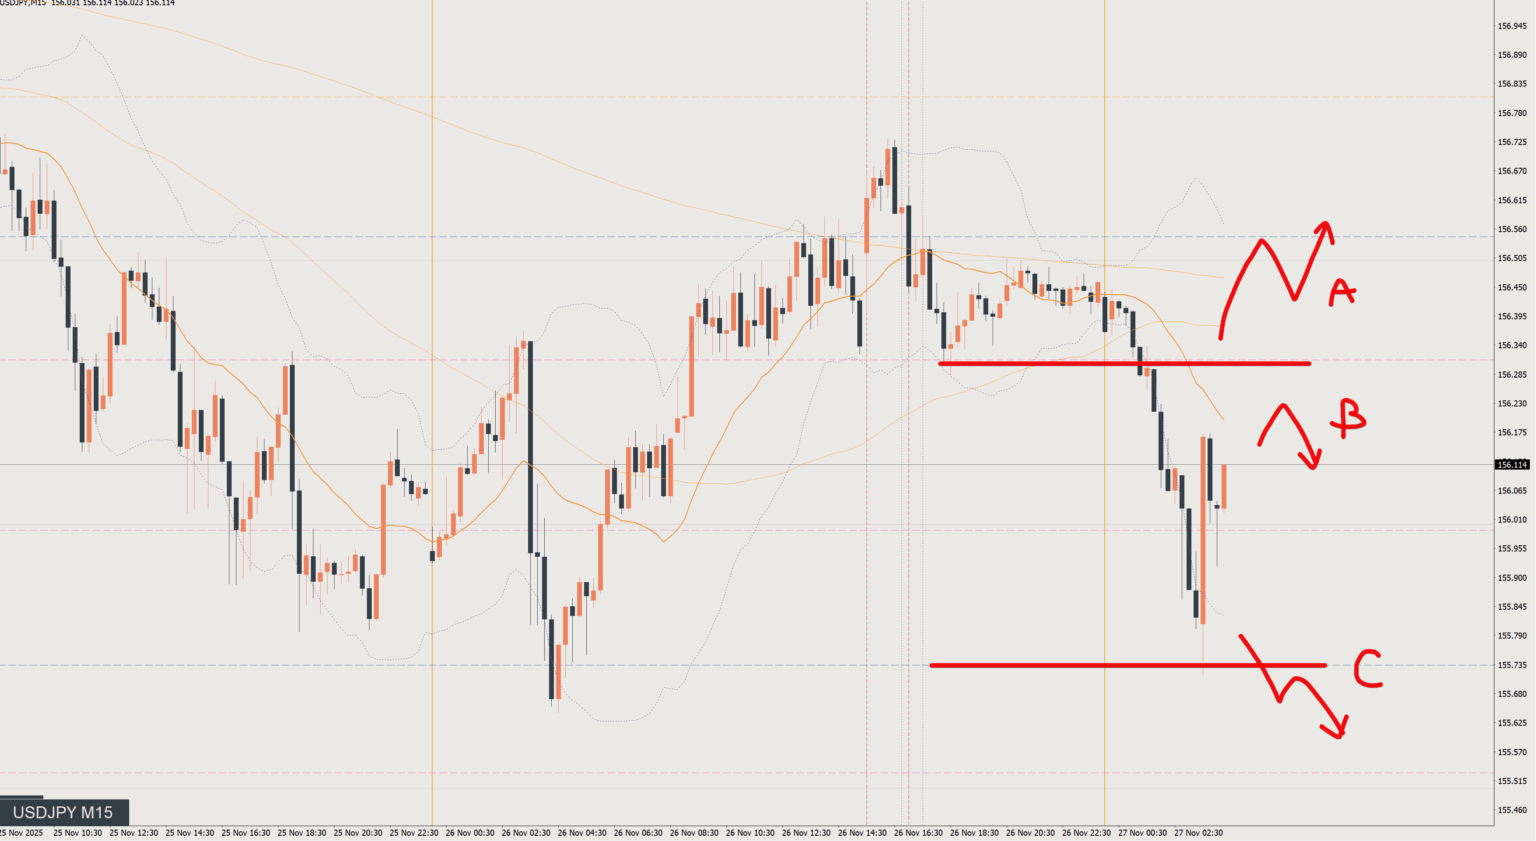
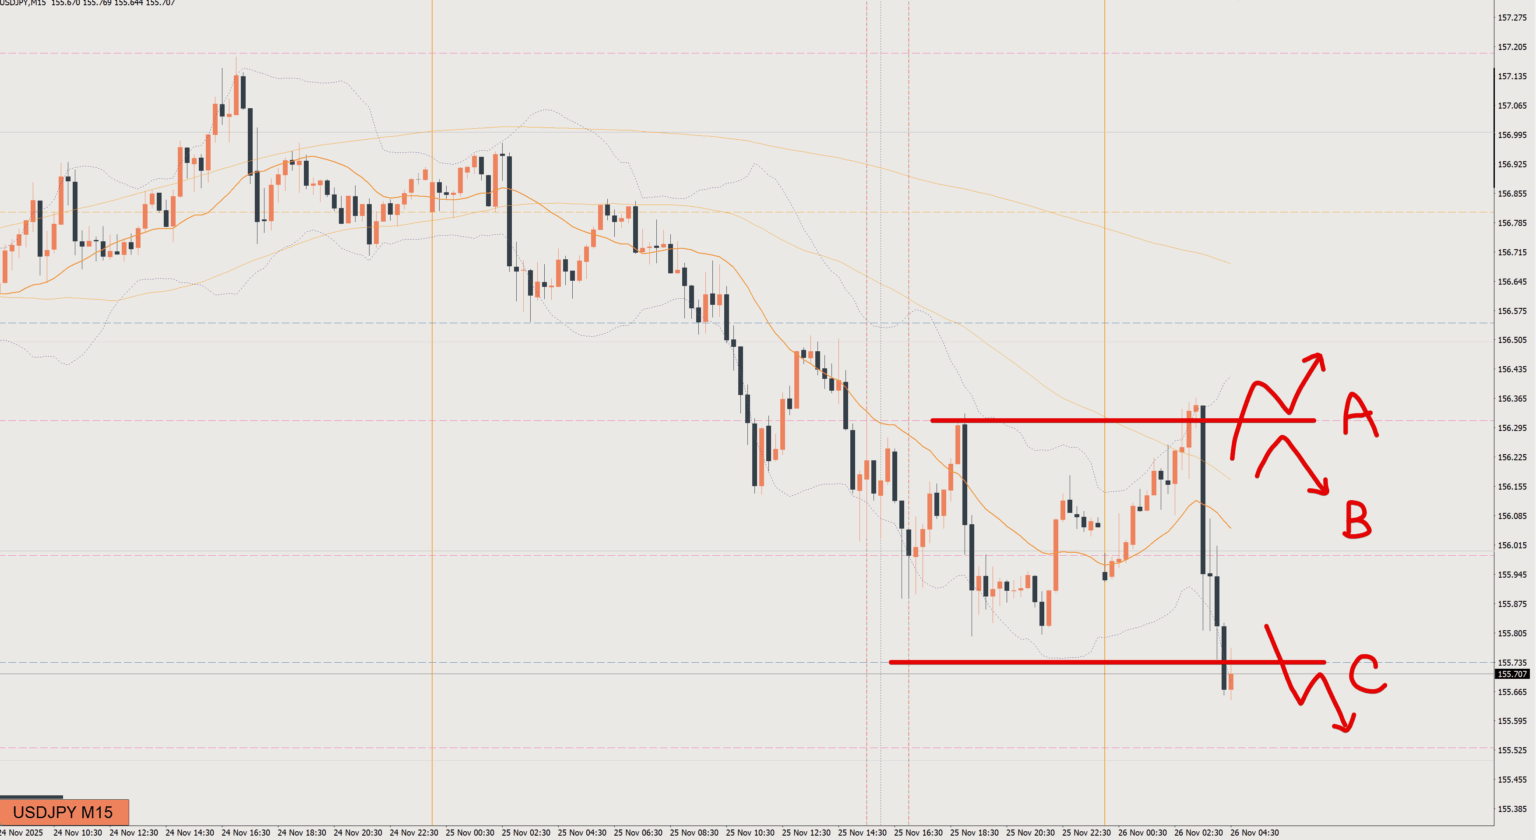
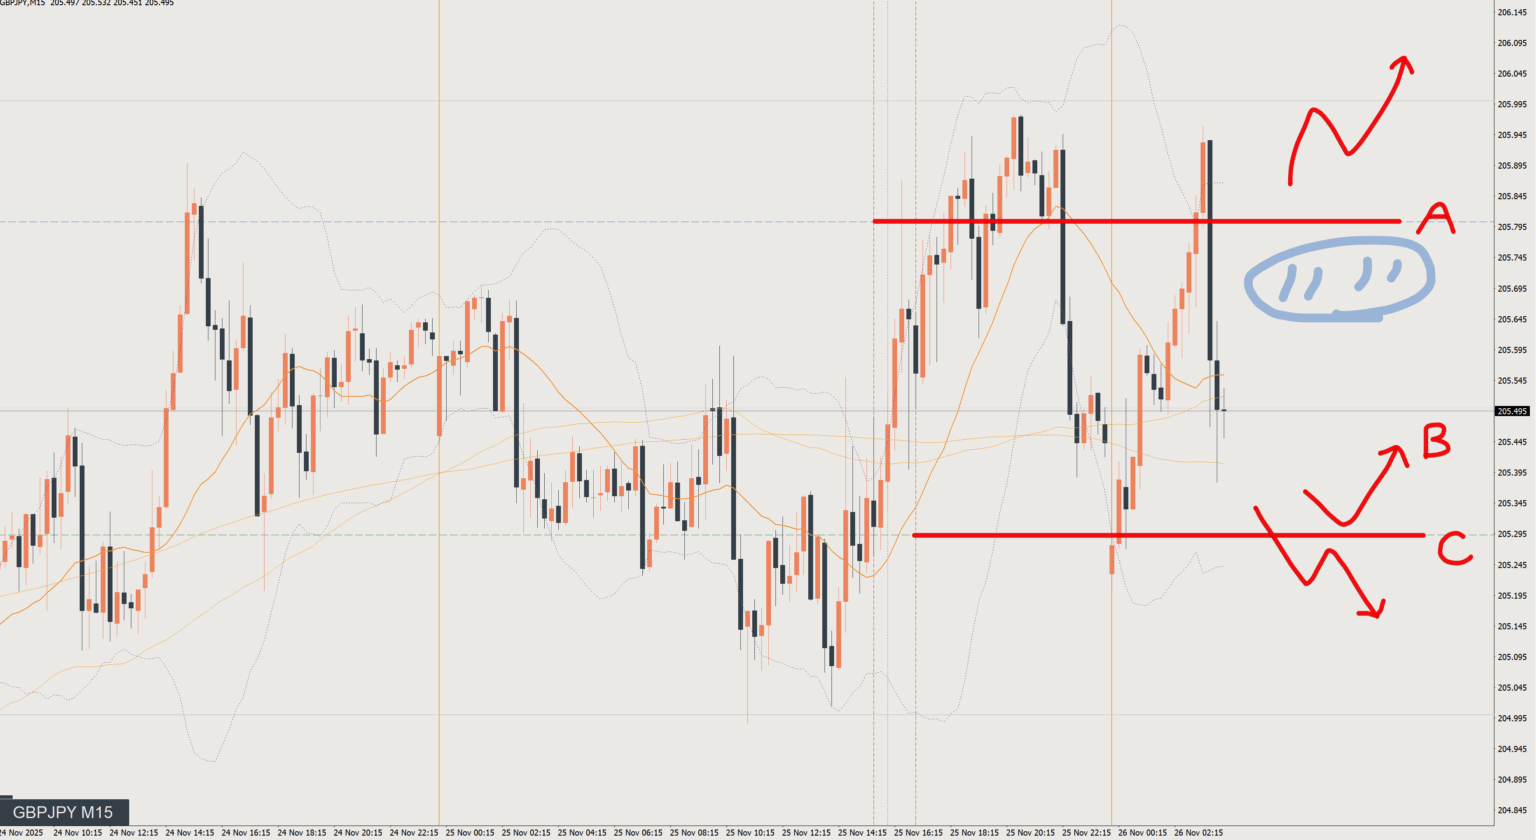
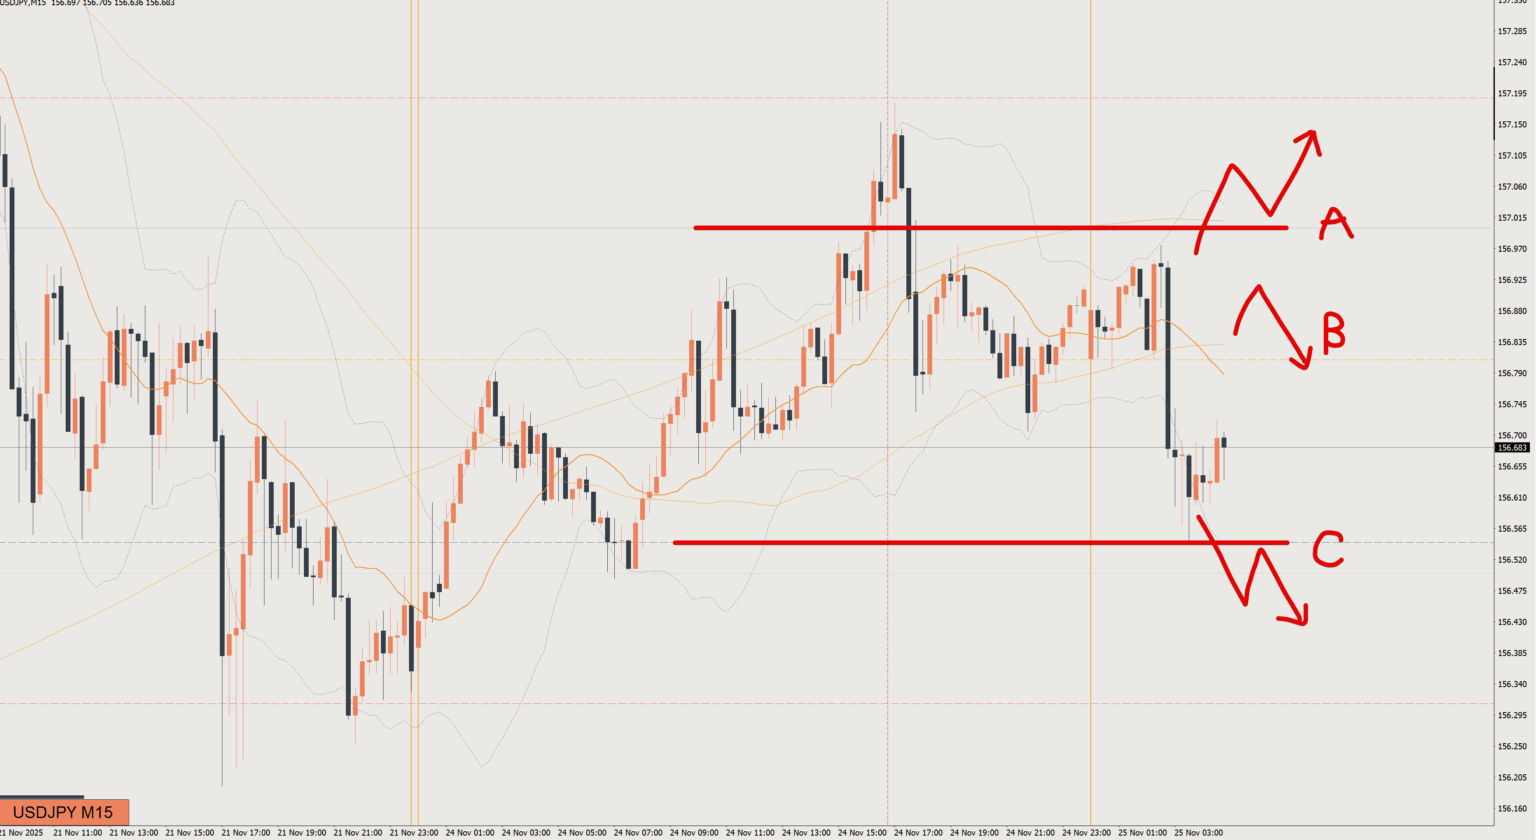
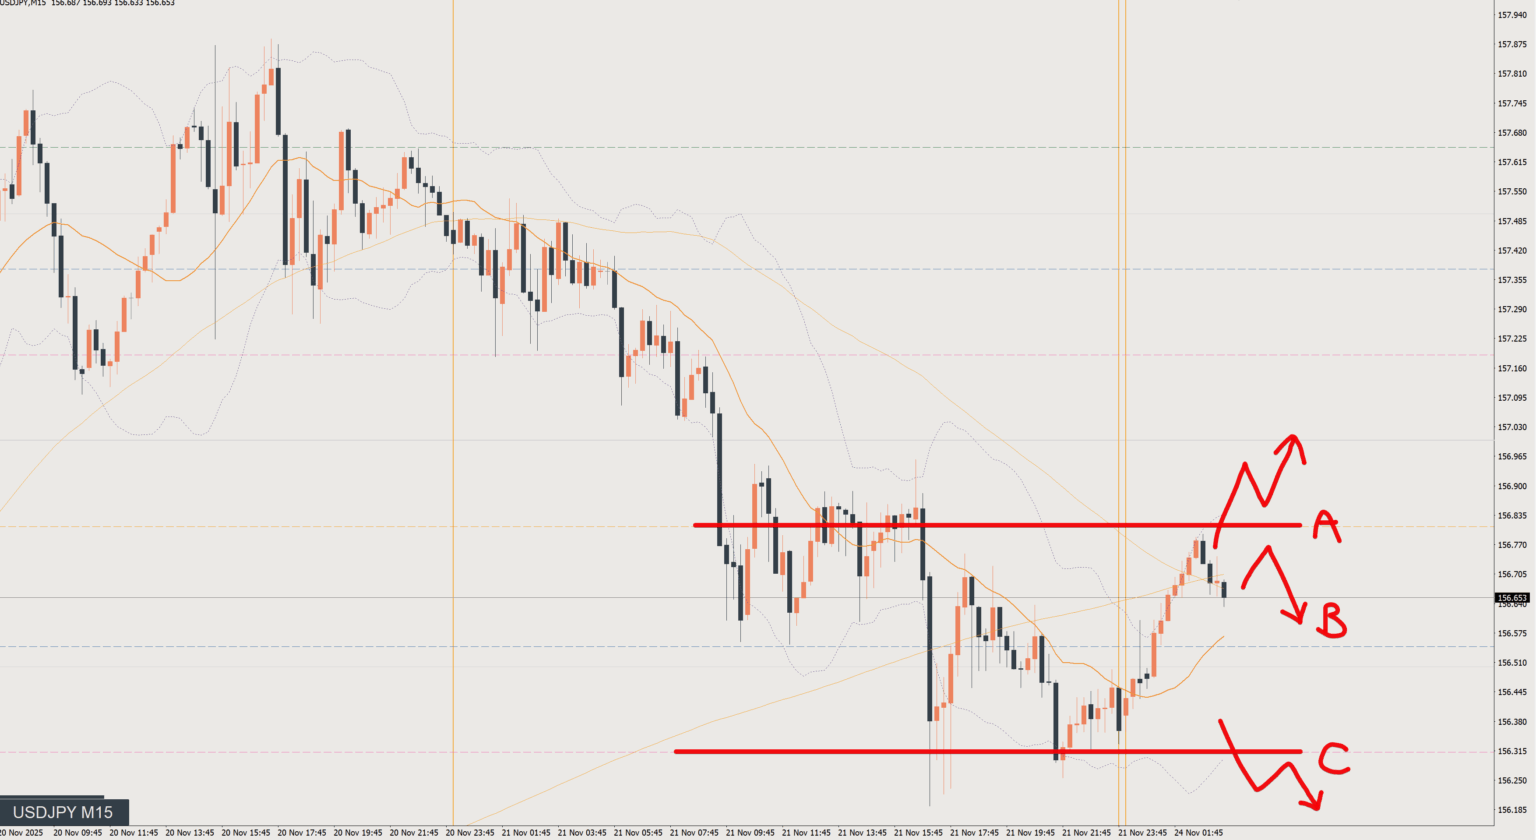
In the short term it's starting to look like it wants to rise, but on a 1-hour chart (H1) basis it's a sell.On the 4-hour chart (H4) this is a price zone where support is likely, so it's important to clearly decide which timeframe you're targeting.
Still looking to buy.From here the stop-loss level would be far away, so I'll look for confirmation on the lower timeframes and wait for a timing with a good risk-reward.
My bias is basically bearish, but this decline is forming a pullback on the daily chart.On the 4-hour chart (H4), price is reaching a price zone where it should soon find support, but the daily pullback might be a bit lower?
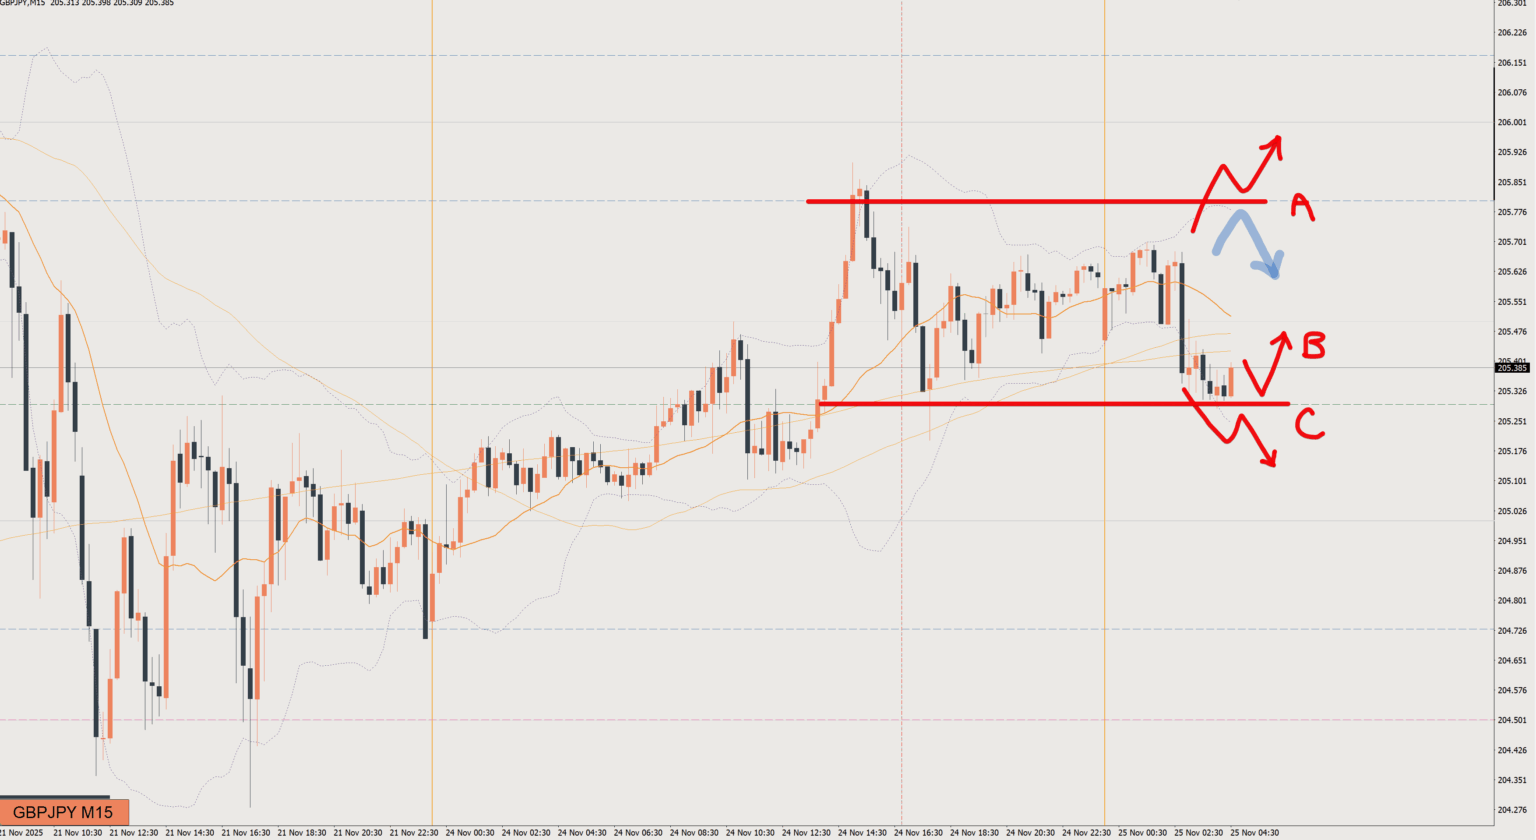
On the 15-minute level it's a buy, but the higher timeframe picture is starting to hint at a move lower.It seems best to look for buys as the base case while staying prepared for a switch to selling.
The bias is to sell, but it does feel like the decline is bottoming out.On the 4-hour chart too, price has reached just the right spot to form a pullback and move higher.
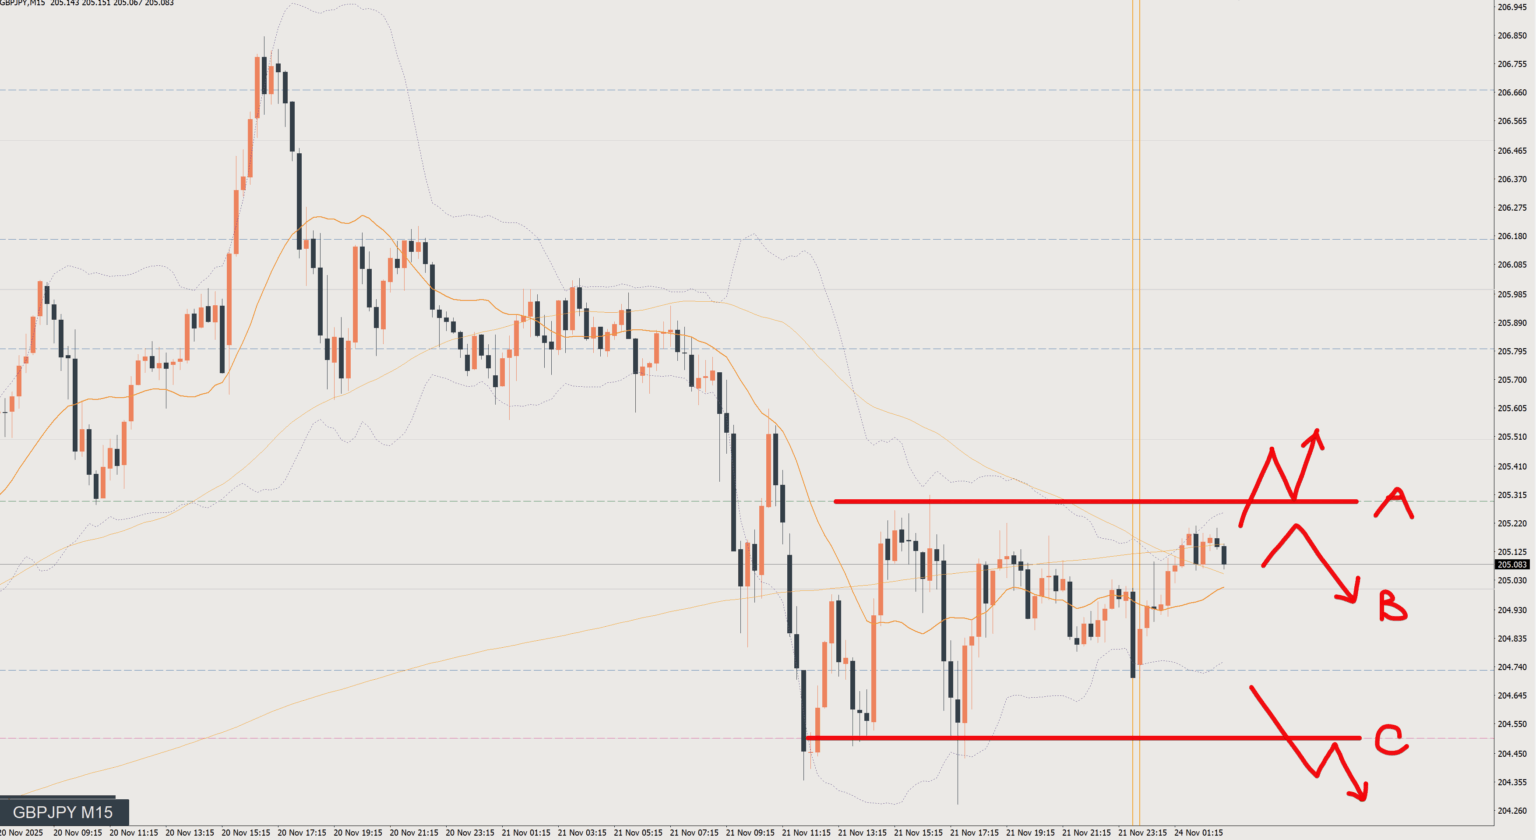
The 1-hour chart says sell, while the 4-hour chart may be forming a pullback.Within the range, lows have been turning up, so the flow may well be leaning toward buying.
The bias is still to buy for now, but price has reached a key level and momentum is fading.The 1-hour chart (H1) has also turned into a range, so I don't really feel like buying aggressively.
Price has climbed quite far already, so I think the momentum will start to fade, but I'm still looking to buy.In the short term it's a range, and if price breaks below the current level I'll consider selling too.