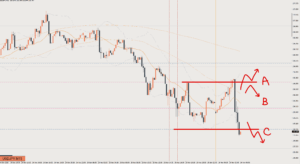
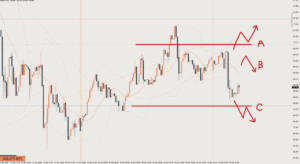
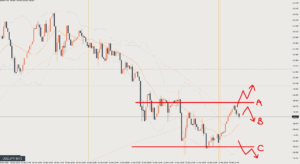
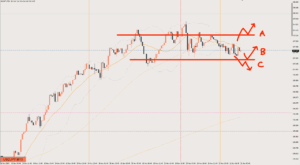
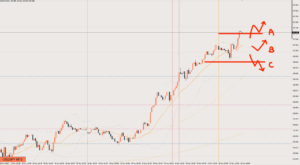
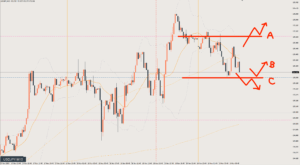
2025/11/27 USD/JPY Trade Strategy

Today's USD/JPY call: Sell.
In the short term it’s starting to look like it wants to rise, but on a 1-hour chart (H1) basis it’s a sell.
On the 4-hour chart (H4) this is a price zone where support is likely, so it’s important to clearly decide which timeframe you’re targeting.
Scenario A
A buy scenario from a pullback after price breaks above around 156.5, the starting point of the current decline.
The 4-hour chart (H4) is in the process of forming a double bottom, and if the 15-minute chart also shows higher lows, there seems to be a good chance of a solid rise.
Target is around 157.1–2
Scenario B
That said, for now I have a bearish bias.
It’s shaping up to rise from short-term higher lows, but I expect it to be stopped for now at the line just above B.
I’d like to set up a short from there.
However, that short could stall out without making a new low.
If that happens, a rise becomes highly likely, so I’d need to consider Scenario A.
Target for the short is the C line
Scenario C
A selling-the-rally scenario after the C line breaks.
This is the pattern where the daily chart goes on to form one more, deeper pullback.
Target is around 155
Review

No trade
As written in Scenario B, price failed to make a new low and then started moving up, but it didn’t just keep rising and instead turned into a range.
If you’re looking at it based on the 4-hour chart (H4), buying from around the red circle also gives a good risk-reward.
This article reflects the author's personal view of the market. It does not recommend any specific trade; all investment decisions are your own responsibility.