2025/07/30 USD/JPY Trade Strategy

Today's USD/JPY call: Sell.
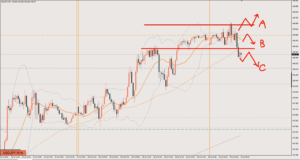
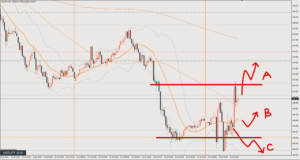
Price has broken below the blue line, but it’s still a range.
I’m waiting for a retracement, so this is the time to see where the short-term rise stalls.
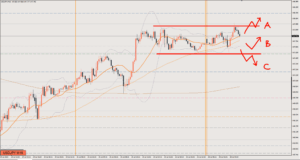
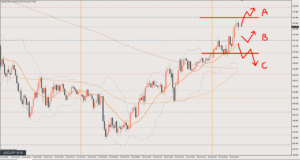
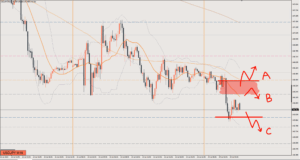
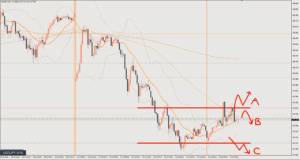
Scenario A
If price breaks above the yellow line, it will make another run at the daily chart high.
Target: 149
Scenario B
Selling the rally against the current decline.
The zone to watch is somewhere between the 15-minute chart (M15) S/R around 148.3 and the blue line at 148.2.
The blue line is a key level I’d been watching on the 4-hour chart, and since price has broken below it, another possible scenario is that price gets rejected at the blue line a few times and then drops.
If selling from the blue line, waiting for a double top to form is a prerequisite.
Scenario C
If price breaks below the pink line, there will be almost no reason left to buy.
This might be the easiest pattern to enter.
Target: 147.6
Review

It was Scenario B.
Short at ○1, where price fails to break above the blue line, forms a double top and drops.
However, it can’t break below the recent low and comes back up, so I exit. 18 pips
After that, price rises and makes a bullish shift, so long at ○2.
But here I close out before the data release. 15 pips
No more opportunities after that.
A spot like the blue ○ is a place where you could look for another short.
However, the daily chart is rising and some traders see this area as the pullback low of the 4-hour uptrend, so it would be a short taken with the possibility of price turning back up from here in mind.
This article reflects the author's personal view of the market. It does not recommend any specific trade; all investment decisions are your own responsibility.