2025/07/23 USD/JPY Trade Strategy

Today’s USD/JPY: buy in the near term.
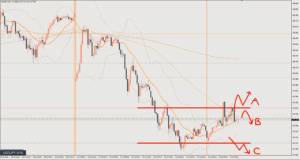
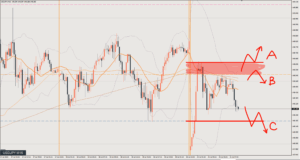
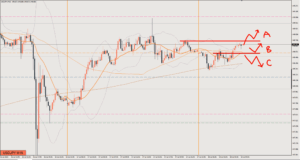
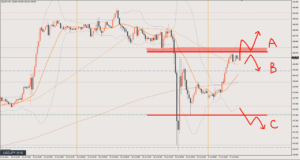
The daily chart is rising, while the 4-hour and 1-hour charts are falling.
For day trading I have a bullish bias, but if price can’t get above around 147.15, that could be an ideal place to sell.
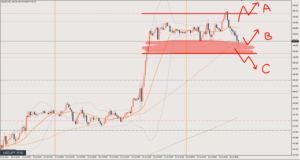
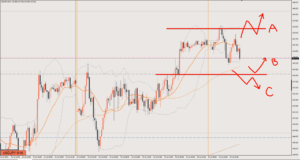
Scenario A
If price breaks above the blue line around 147.15, I’ll see it as a move higher for now.
However, the 4-hour is still falling, so don’t get greedy.
Target: 147.5
Scenario B
A pattern where price makes a pullback first and then aims higher again.
Don’t forget that the 1-hour is in a selling phase.
Target: the recent high at 147.15, or 147.5
Scenario C
If price falls from the current shape, sell on a break below the yellow line at 146.4.
That said, this looks unlikely.
If price makes another move higher, the level where I’d call a bearish shift will be further up.
Target: 145.9
Review

This was a short from the red circle.
However, this falls under the bearish scenario from the morning plan for when price fails to break the range high, so it was a trade taken after the trade strategy was updated. (Not counted)
As written in the morning scenario, price couldn’t get above the 147.15 area, and it turned into a perfect place to sell.
The best point to enter short is the blue circle.
It’s where the 1-hour chart (H1) forms a clean support/resistance (S/R) level, the 15-minute chart (M15) makes a double top, and the 5-minute chart (M5) starts turning down (making lower highs).
With a stop distance of about 15 pips against an expectancy of 80 pips, this is a spot worth actively targeting.
That said, if you use the 15-minute chart (M15) for trade execution, the blue circle is countertrend trading.
If you follow the rule of not trading countertrend, the entry point is the red circle.
The textbook play is to take it from there down to the range low. 58 pips
This article reflects the author's personal view of the market. It does not recommend any specific trade; all investment decisions are your own responsibility.