2025/07/17 USD/JPY Trade Strategy

Today's USD/JPY call: Sell.
The 1-hour is a sell, but the 4-hour is rising from the pullback low.
It’s also turning up (making higher lows) in the short term, so I can’t sell yet.
The strategy changes depending on which timeframe you anchor on.
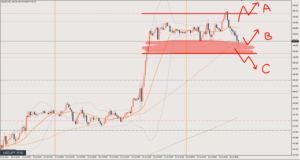
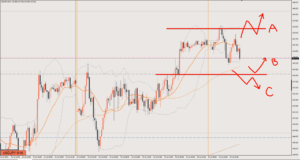
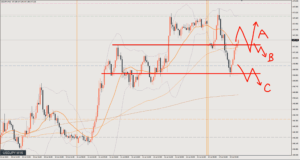
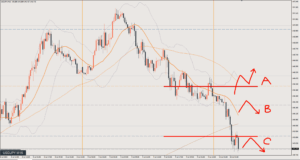
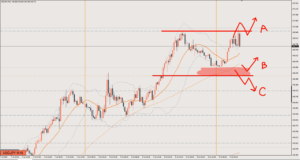
Scenario A
Yesterday’s range low has become today’s range high.
If price breaks above the yellow line at 148.5, I’ll look to buy the dip.
Once price clears this price zone, the weekly chart will start turning bullish too.
Target is 149.1
Scenario B
If price can’t break above the range, it’s a sell.
As I wrote at the top, it’s a buy in the short term.
Once the upward flow completely breaks down, I’ll look to go short.
Target is 147.6
Scenario C
The range low is the green line at 147.5.
If price breaks below around there, I’ll look to sell.
If it breaks the green line, the chance of this becoming a pullback on the daily chart increases.
In that case it could drop to around 146.5, but the day-trade target is 147
Review

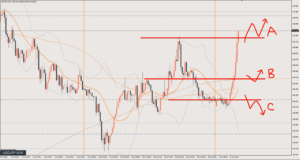
It played out as Scenario A, but it didn’t extend.
First, I went long at ○1, the pullback after price broke above the yellow line.
But it stalled without making a new high, so I exited. About 5-6 pips.
That said, if you don’t like making small trades, holding here is fine too.
It’s a buy until price breaks below the yellow line.
After that I waited and saw, but price broke above the high again, so I went long at ○2, the pullback that followed.
I held it right up until the data release, but closed out before the release. 18 pips.
On days when the market doesn’t move, there’s no way to make pips no matter what you do.
This article reflects the author's personal view of the market. It does not recommend any specific trade; all investment decisions are your own responsibility.