2025/10/16 USD/JPY Trade Strategy

Today's USD/JPY call: Sell.
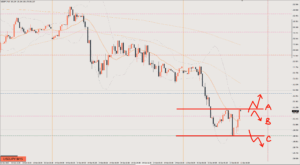
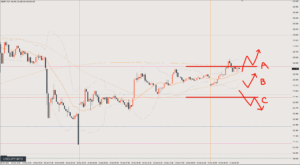
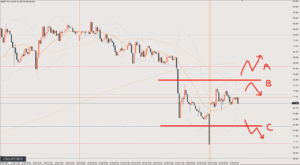
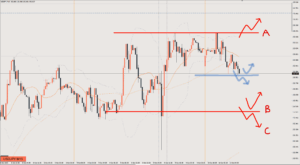
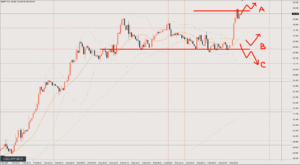
The 4-hour and 1-hour charts are sell setups, and the daily chart is hard to buy too.
The only thing is that the current price might find a bit of support on the 4-hour chart, so just watch out for that.
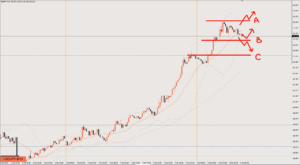
Scenario A
If price breaks above the recent high, I can’t sell.
That said, it doesn’t feel like it will keep climbing either.
If it gets above the Line A area, the daily chart could form a bullish candle with a lower wick, and then the mood starts to become “maybe it goes up tomorrow?”
If buying, the target is around 151.4
Scenario B
This is a scenario of selling the rally from around the green line near 150.9.
The target is the recent low at 150.5, but if it breaks below, that’s a bonus.
Scenario C
If it breaks below, wait for a retracement and go short.
However, I can’t really picture it continuing to fall in its current shape, so I think it would be more natural for it to form a retracement wave first and then drop.
If it heads lower, the target is around 150
Review

It played out as Scenario A.
If you were watching the lower timeframe, this was a relatively easy pattern to enter.
The ideal exit is the blue circle.
The blue circle is the point where price reached 151.4, which I had written as the target for Scenario A.
However, price only touched it for a moment and dropped right away, so even with a limit order set, it may not have been filled.
Realistically, the take profit would be at the red dot, where price rose once more and then turned down (making a lower high). 19 pips
This article reflects the author's personal view of the market. It does not recommend any specific trade; all investment decisions are your own responsibility.