2025/09/29 USD/JPY Trade Strategy

Today's USD/JPY call: Sell.
This is a decline as the 4-hour chart looks for a pullback.
Price may already have reached the pullback, but for now I’m still viewing this from the sell side, so I’ll wait for a retracement.
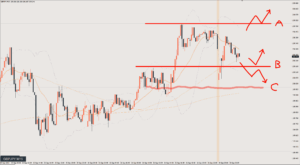
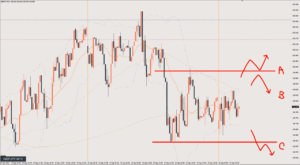
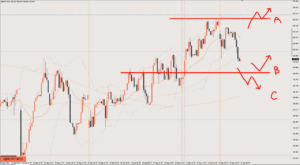
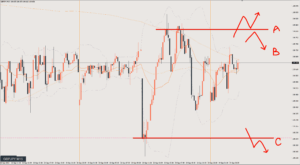
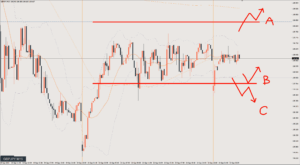
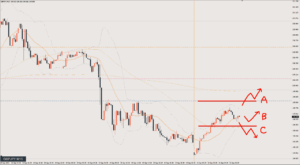
Scenario A
A break above Line A is a bullish shift.
If it breaks, I’ll be looking for a move up to the recent high on the daily chart, but the near-term target is 150.5.
Scenario B
If price retraces to just below the Line A zone, I’ll look to sell.
However, Line C could become the pullback on the 4-hour chart, so if price stalls around there, I’ll exit.
If it drops another leg, the target is around 149–148.8.
Scenario C
Selling the rally after a break below Line C.
As mentioned in Scenario B, this price zone needs caution.
If I sell, I’ll be expecting a drop to around 148.8 near the lower pink line, but if I sense downside stalling, I’ll need to exit early.
Review

It was Scenario C.
Price moved down without much of a retracement.
I went short from the 5-minute chart (M5) level support/resistance (S/R) at the pink line I had described in Scenario C.
After it broke through the target, I took profit when the decline stopped at the yellow line, which is a key level on the daily chart. 55 pips
This article reflects the author's personal view of the market. It does not recommend any specific trade; all investment decisions are your own responsibility.