2025/09/22 GBP/JPY Trade Strategy

Today's GBP/JPY call: Buy.
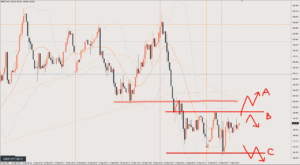
Right now I’m looking to buy, but the 4-hour chart is falling, so this feels like a correction within a decline.
The daily chart can’t be called a sell yet. Looks like a tricky environment.
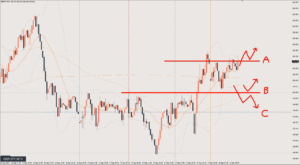
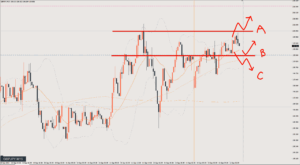
Scenario A
If price breaks above Line A, I think buying is fine.
Line A is the 1-hour rally high, so a break above it would mean a bullish shift on the 1-hour chart as well.
Target is around 200.3
Scenario B
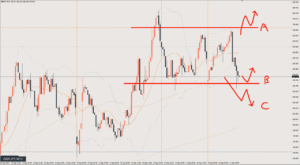
On the 15-minute waves, price looks like it’s forming a pullback and getting ready to rise.
However, this is a 1-hour resistance price zone, so watch out for the pattern where price rises but fails to make a new high and loses momentum.
Target is around 199.8
Scenario C
If price breaks below the support around 199.4–199.5, I’ll consider selling.
That would be a move to test the daily chart low once again.
Target is 199
Review

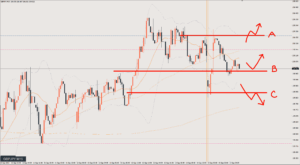
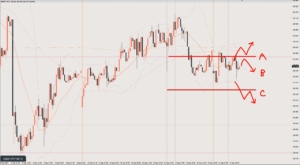
It played out as Scenario B.
However, price never broke out of the range and kept moving within the same price zone.
The line I had drawn as the C line was a 15-minute support line, and looking closely, the 1-hour chart (H1) also has a bullish bias from there, but depending on how you read it, the 1-hour chart (H1) is still bearish.
Because of that, it was a situation where price was unlikely to move on technicals.
The opportunities were the two spots marked with red circles.
Simply buy at the range low and sell at the range high.
Both only offer about 10–15 pips.
This article reflects the author's personal view of the market. It does not recommend any specific trade; all investment decisions are your own responsibility.