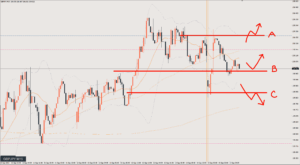
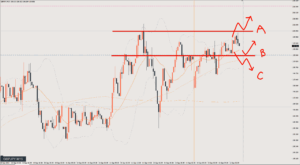
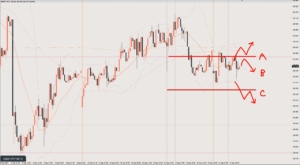
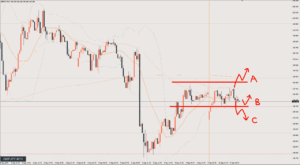
2025/09/16 GBP/JPY Trade Strategy

Today's GBP/JPY call: Buy.
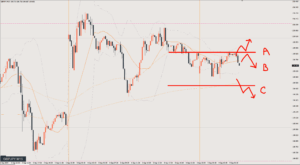
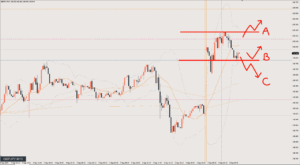
The yellow line is a key level on the weekly chart, and whether price breaks above it is the key point.
The 1-hour chart is ranging, so the strategy is to buy from the range low.
Scenario A
A pullback after a break above the yellow line.
I’d like to simply buy here, but at a weekly key level you also get false breakouts on the 1-hour and 4-hour timeframes, so it’s best to be strict with your exit decisions to avoid buying the top.
It’s important never to assume that price “will go up.”
Target is 201.4
Scenario B
Buy if price stops falling around the current price zone.
Even a move within the range can give you about 20–30 pips.
If it breaks out to the upside, that’s a bonus.
Target is the yellow line at 200.6
Scenario C
If price breaks below the range, it might turn into a deeper pullback? That’s the scenario.
It’s basically a buyers’ market, so if you sell, watch out for a sharp rebound.
Target is around 200
Review

Since price dipped once, I’m working on the assumption of Scenario C.
Short from ○1 after the UK data release.
On the 1-hour chart (H1), this area is still just barely the range low, so this is an entry made while watching out for a bounce.
In the end, it becomes either a divergence exit or a breakeven exit where the 5-minute chart (M5) starts turning up (making higher lows).
What follows comes after the scenario update, but breaking the low once makes it easier to sell from the range high.
Ideally, you’d be able to short from ○2.
This one also overlaps with a data release, so the short comes after the release, once a head and shoulders forms on the 5-minute chart (M5).
Take profit where the move stalls after reaching the Scenario C target of 200. 50 pips
This article reflects the author's personal view of the market. It does not recommend any specific trade; all investment decisions are your own responsibility.