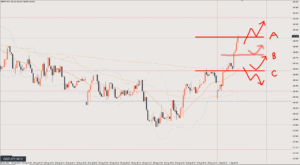
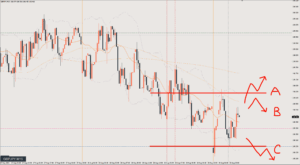
2025/09/10 GBP/JPY Trade Strategy

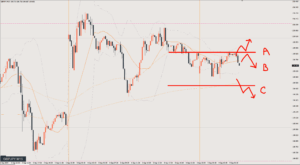
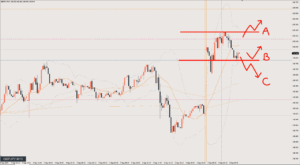
On the 15-minute level it’s still a buy, but on the 1-hour this is a price zone for selling the rally.
There’s no momentum, so it’s fine to start selling around Line A.
If price breaks above Line A, the daily chart turns into a bullish candle.
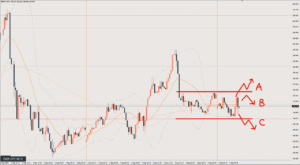
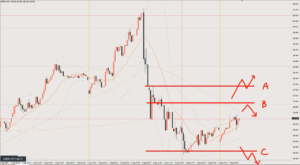
Scenario A
Buying the dip after a break above Line A.
Every timeframe is ranging, so this isn’t a situation where you can aim for a big move.
Target is 199.8
Scenario B
For now, it’s a buy until price breaks below Line B.
The basic strategy is to buy around Line B.
However, the 1-hour is in a spot for selling the rally, and I’m expecting a scenario where price fails to break Line A and drops, so even if you buy from Line B, you can’t expect much room to run.
Target is 199.45
Scenario C
The bearish scenario.
Looking to sell the rally after a break below C.
Initial target is 199.
That’s because it looks like a level that could act as support on the 4-hour.
Review

It played out as Scenario A.
I went long at the red circle, which was the pullback after the range breakout.
However, since price was still in the middle of a retracement on the 1-hour chart, it didn’t rise smoothly and instead climbed while repeatedly chopping up and down.
With the upward momentum seeming to fade, plus a data release coming up, I took profit on the upper wick around 8 pm JST (11:00 UTC). 19 pips
In the end, price did rise to the 199.8 target, but it dropped sharply for a moment on the data release at 9:30 pm JST (12:30 UTC), so if you had still been holding the position, you would have been stopped out there.
This article reflects the author's personal view of the market. It does not recommend any specific trade; all investment decisions are your own responsibility.