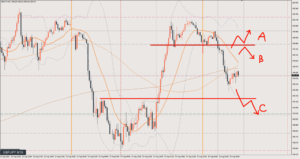
2025/08/22 USD/JPY Trade Strategy

Today's USD/JPY call: Buy.
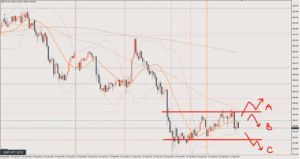
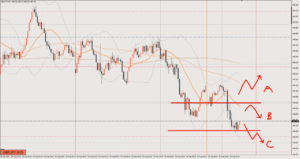
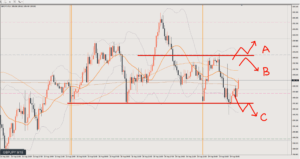
You could buy based on the light red line, but the yellow line just above it will act as resistance.
Even if I buy, I’d like to wait a bit longer for a proper pullback.
Scenario A
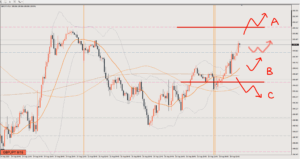
If price clearly breaks above the yellow line, wait for a pullback and go long.
Once it gets above here, USD/JPY will start to turn into an uptrend.
The chart is already starting to break above the yellow line, but I’ll wait for the pullback after a candle body closes above it.
Target: 149
Scenario B
Since price broke to the upside, the B line becomes the short-term pullback low.
However, the moves are too small, so rather than buying as soon as price reaches the B line, it’s better to confirm that it actually forms a pullback first.
On the 1-hour chart, it’s still a buy even if price drops below the B line.
If it falls below the B line, I’ll wait for it to turn back into an uptrend somewhere between there and the blue line at the range low.
The target is the same as A, but breaking through the yellow line is the first hurdle.
Scenario C
If price breaks straight down, I’ll look to sell.
It won’t turn into a full-fledged decline, so the target is around 147.9
Review

It was Scenario A.
It counts as Scenario A since it was a pullback after the price had broken higher, but it was a deep pullback that went all the way down to the Scenario B line before rising.
Since it was the pullback low, the risk-reward was good.
After entry, the rise stalled at the recent high, so I exited. 20 pips
After that, probably due to fundamental factors, the price dropped sharply and the chart structure broke down, so that was it for the day.
This article reflects the author's personal view of the market. It does not recommend any specific trade; all investment decisions are your own responsibility.