2025/08/18 GBP/JPY Trade Strategy

Today's GBP/JPY call: Buy.
On the bigger picture, we’re near the range high.
This isn’t a spot to just keep chasing the move, so I’d like to confirm the price is holding firm before buying.
As before, be careful not to buy the top.
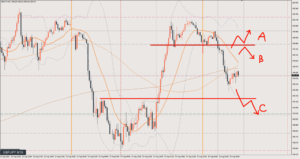
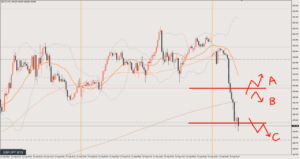
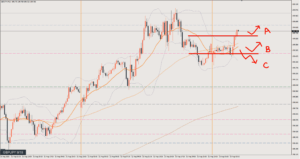
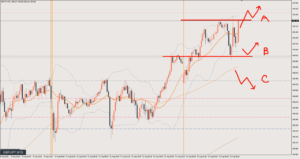
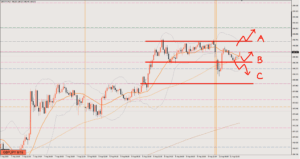
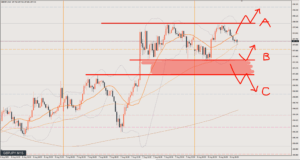
Scenario A
I’m viewing the range a bit more broadly.
I’m treating the pink line around 200.2, the recent high on the 1-hour chart, as the range high, and if price breaks above it, I’ll be buying the dip.
Watch out for a brief fake breakout, though.
Ideally, I’d like to have a position in before the breakout.
Target is 200.6
Scenario B
A pattern where price forms one more wave within the range.
I’m waiting with the idea of a pullback to around 199.7.
If the pullback is deep, I’m allowing for it to go as far as the pink line around 199.5 at most.
On the other hand, if price rises to around Line A, it could form a shallow pullback at the blue line and then rise.
I’m waiting with those three possibilities in mind.
Target is around 200.6, the same as Scenario A.
When buying from lower levels, the first decision point will be whether price can break out of the range.
Scenario C
If price drops below the pink line at 199.5, I’ll see it as a bearish shift.
Even in this case, it’s turning down (making lower highs) within an overall bullish mood, so it will basically be movement within the range.
I’ll properly wait for a retracement and for a setup where the upside is capped before going short.
Target is around the green line at 199, the range low.
Review

It was Scenario B.
Price briefly breaks below the pink line too, and there’s a short-term bearish shift, so I think it’s a bit hard to get in.
However, as you can see from the shape of the 1-hour chart (H1), you can treat this as turning up (making higher lows) after touching the pullback low and enter.
On the 5-minute chart (M5), it’s a buy from a situation where the lows keep getting higher.
This is a spot to enter with the view that price will rise to the range high for now.
Take profit where it stalls at the pink line at the range high and starts to fall. 44 pips
This is where it turns into a double top turning down (making lower highs) on the 5-minute chart (M5).
This article reflects the author's personal view of the market. It does not recommend any specific trade; all investment decisions are your own responsibility.