2025/10/28 USD/JPY Trade Strategy

Today's USD/JPY call: Sell.
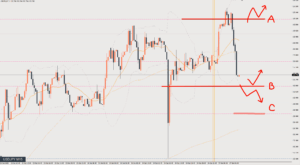
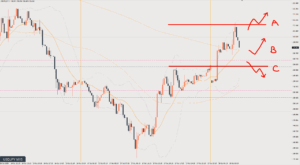
Price failed to break above the daily chart high and is now moving lower.
Will it find support in the current price zone, or drop another leg?
This looks like a price zone where it could range for a while and then rise.
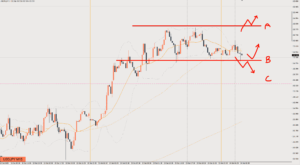
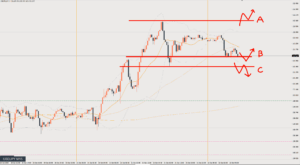
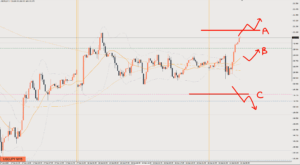
Scenario A
I think a V-shaped reversal up from here is unlikely, so if price breaks above Line A, there’s a good chance market conditions have changed.
For now, I’ll switch to a bullish bias if it breaks above Line A.
The target is 153.1, and I’m also anticipating a break above the daily chart high.
Scenario B
Ideally, price pulls back up to around here.
Around Line B or the blue line below it.
The target is 151.5
Scenario C
The pattern where price keeps falling without much of a pullback.
Line C also acts as resistance, so if price gets rejected there a few times, I’ll sell.
The target is also 151.5
If it drops to 151.5, I expect it to bounce at least temporarily.
If the weekly chart forms a bullish candle again this week, the area around Line C could act as support, followed by another move up.
At the day-trading level, selling is the only option, but it’s safer to keep the broader market picture in mind.
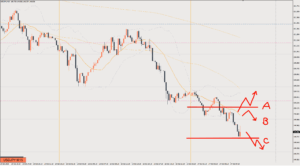
Review

It was Scenario B.
Short from where price stalled near Line B and started turning down (making lower highs).
Exit where it failed to make a new low and started turning up (making higher lows). 23pips
The exit point is also a spot where you could buy for a short-term move.
This article reflects the author's personal view of the market. It does not recommend any specific trade; all investment decisions are your own responsibility.