2025/09/03 USD/JPY Trade Strategy

Today's USD/JPY call: Buy.
The question now is whether price breaks above the daily chart range high that formed in August.
It feels like price put in a pullback and is making another attempt, but if it fails here, it will drop back into the range again.
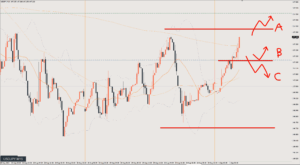
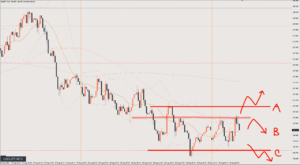
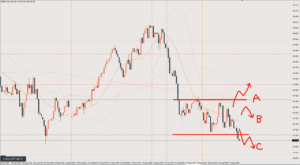
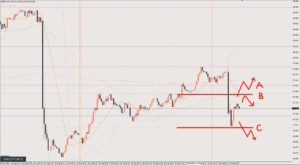
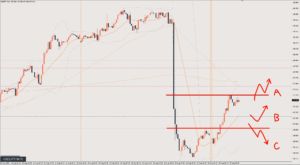
Scenario A
A break above Line A means a breakout from the range.
After that, I expect a rise toward the daily chart high, and I’d like to target a pullback.
Because the range has lasted so long, the upside target is 150.9.
I think it’s rare for price to rise that far in a single day, so it’s also necessary to decide on take profit by watching the horizontal levels and the price action on the 15-minute chart.
Scenario B
Buying the dip from inside the range.
I’m looking to buy around 148.3.
The target is the same as Scenario A, but if price can’t get above Line A, I’ll exit.
Scenario C
Sell on a break below Line B.
Target is 147.5
Review

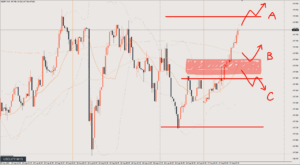
It played out as Scenario A.
Price breaks Line A, but it hasn’t broken the recent high, so you need to treat it as still being in a range.
On the pullback after that, you can go long at the red circle.
It rallies sharply, but stalls at the pink line and drops fast, so exit around the candle close that leaves the long upper wick. 39 pips
After that, it’s a spot where you could look for a short around the light red circle.
However, with a data release coming up right after, it’s a pass.
This article reflects the author's personal view of the market. It does not recommend any specific trade; all investment decisions are your own responsibility.