2025/08/18 USD/JPY Trade Strategy

Today's USD/JPY call: Buy.
The bias is technically long, but conditions remain difficult.
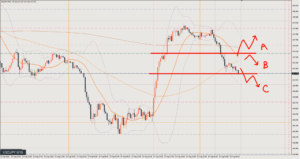
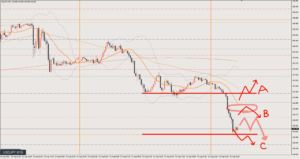
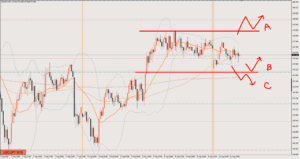
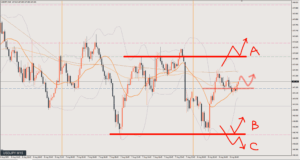
Both the 4-hour chart (H4) and the 1-hour chart (H1) are ranging, and price is right in the middle of that range.
Short term the bias is to buy, so the strategy is to buy from points where price finds support.
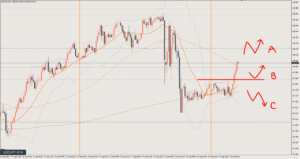
Scenario A
Even if price rises straight from here, I won’t panic and will wait patiently for a pullback.
If I get left behind, I can just rebuild the strategy.
Basically, I’ll wait until price comes near the pullback low on a shorter timeframe like the 15-minute chart, and buy with a high risk-reward ratio.
Target is 147.9
Scenario B
I see the current range low on the 15-minute chart around the blue line at 147.2.
The recent high is around 147.3, so this pattern aims at buying the dip from the 147.2–147.3 price zone.
I’d like to set the target at 147.9, same as Scenario A, but if price gets capped at the green line at 147.5, I’ll exit.
Scenario C
If price breaks below the blue line, I’ll consider selling.
However, even if I sell, this isn’t a market that will keep falling steadily.
I’ll wait patiently for a retracement and enter once the upside is being capped.
Target is around 146.7–146.8
Review

It was Scenario B.
Price pulled back to the blue line, and I went long once it stopped falling.
I took profit when it stalled at the green line. 20 pips
Here, it would also be fine to hold and wait and see, accepting the risk of giving back the profit.
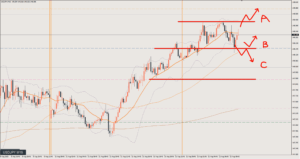
The 1-hour chart was forming an upward wave, and this trade caught a pullback within it.
If you had held, you could have ridden it all the way to the 147.9 target.
This article reflects the author's personal view of the market. It does not recommend any specific trade; all investment decisions are your own responsibility.