2025/08/13 USD/JPY Trade Strategy

Today's USD/JPY call: Buy.
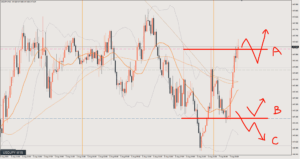
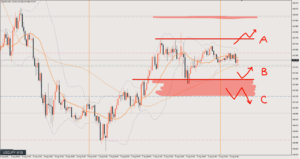
The 4-hour chart was a buy and the 1-hour a sell, but the 15-minute chart (M15) has broken above the key level of 147.9 and is rising.
The 1-hour chart is forming a double bottom, so I’d like to wait for a pullback to around the neckline.
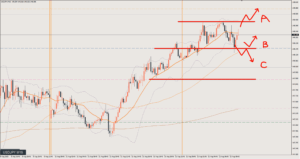
Scenario A
If price keeps rising from here, I’ll still wait for a pullback, but basically I’ll look to enter where chart support/resistance (S/R) and horizontal levels line up.
That said, the blue line around 148.2–148.4 will act as resistance.
Be careful not to buy at the top.
Target is 149.5
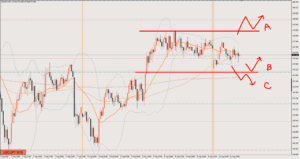
Scenario B
The pattern where price pulls back to around the neckline of the 1-hour double bottom.
Between the pink line, which is that neckline, and the blue line above, buying and selling will be mixed.
If buying, I’d like to buy from the lower part of this zone.
Target is 148.4
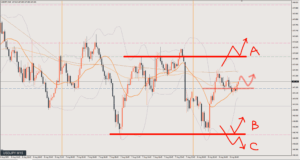
Scenario C
If price breaks below the pink line and also takes out the recent low, I’ll consider selling.
Target is 147.5
Review

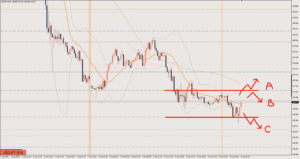
The price fell.
This trade came after market conditions changed and I rebuilt the strategy.
It’s a short from the green line, a clear support/resistance (S/R) line on the 1-hour chart (H1), where the 15-minute chart had also already made one small retracement.
Circle ① is the first opportunity.
Take profit where the move stalls at the blue line, the recent low. 22 pips
After that, if you follow the textbook, circle ② is a point where you could enter.
The risk-reward here is very good too.
I don’t trade this late at night, so anyone who was trading it got lucky, I suppose.
This article reflects the author's personal view of the market. It does not recommend any specific trade; all investment decisions are your own responsibility.