2025/07/08 USD/JPY Trade Strategy

Today's USD/JPY call: Buy.
This chart is easier to read than GBP/JPY.
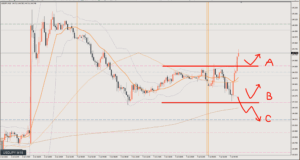
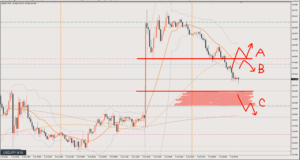
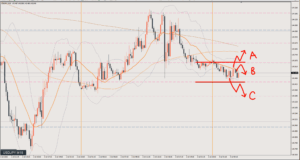
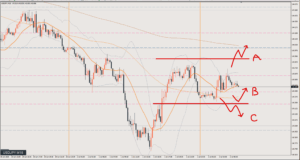
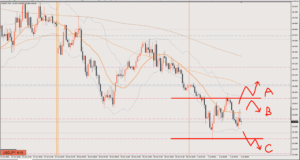
I think it’s one of two options: either it bounces from around the current price, or it bounces from the range low around 145.9.
Scenario A
The yellow line is a key level on the weekly chart.
In other words, price is currently in a price zone that acts as resistance, so watch out for false breakouts and sharp drops.
Keeping that in mind, if it makes a new high, I want to look for buying the dip.
Target is 146.9
Scenario B
Go long once it turns up (making higher lows) within the current range.
The current chart position does look like a good spot for a bounce.
It’s been turning down (making lower highs) in the short term, so I’ll wait a bit longer.
Initial target is the recent high at the yellow line, 146.4
Scenario C
If it breaks below the range, I’ll follow it with a sell.
A bit of a drop would actually make it easier to catch the next move up.
Target is around 145.3
Review

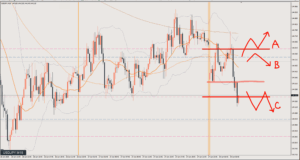
It played out as Scenario B.
The first opportunity was ○1.
It’s a buy from support/resistance (S/R), set against the recent double bottom.
Price makes a slight adverse move after entry, but the stop-loss level is around the blue marker, and the market context gives no reason to exit early, so I hold.
After that, price keeps making higher lows, so you just leave it alone.
If you’re joining from the European session, you can go long from ○2.
It’s a long based on price turning up (making higher lows) within the range plus a short-term pullback low.
Price quickly breaks through the range high of 146.4, which was the target in Scenario B, so I hold toward 146.9, the target I wrote for Scenario A.
Take profit once momentum fades on the line touch. 80 pips
This article reflects the author's personal view of the market. It does not recommend any specific trade; all investment decisions are your own responsibility.