2025/07/01 USD/JPY Trade Strategy

Today's USD/JPY call: Sell.
The monthly chart closed with a long upper wick, and the weekly chart also closed as a bearish candle, forming a double top.
It looks like price is set up to fall this week.
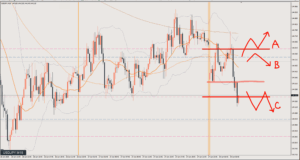
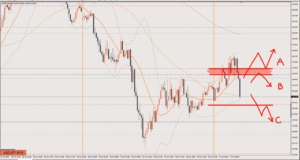
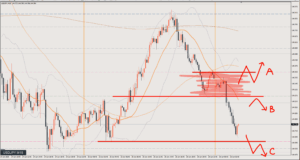
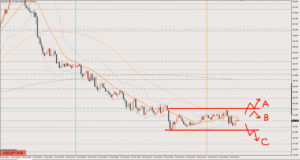
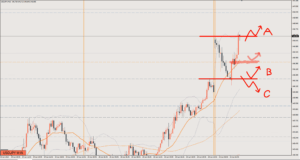
Scenario A
For day trading, I’ll switch to buying if price breaks above the pink line around 143.9.
The overall downtrend hasn’t changed, but on the 4-hour level it’s turning into a range.
Target is 144.2
Scenario B
I see the current range high at around 143.85.
I’m looking to sell the rally from the range high.
If price rises from here, the 1-hour chart (H1) could also look like it’s making higher lows, so be careful about that.
Target is 143
Scenario C
Selling the rally after a break below.
Same target: 143
Review

The move I expected in the morning scenario didn’t happen.
You could short at the first red circle, but price rose again right away, so it ends in a breakeven exit.
The blue circle after that is a technically valid long, but it overlapped with a data release, which makes it tricky.
The red circle after that is a long you could take if you’re someone who watches the charts late at night too.
This article reflects the author's personal view of the market. It does not recommend any specific trade; all investment decisions are your own responsibility.