GBP/JPY Trade Strategy for 2025/08/04

Today's GBP/JPY call: Buy.
After a big drop, price has just started to form a retracement.
For day trading, this is a spot to look at buying the dip.
It’s a reasonable place on the daily chart as well.
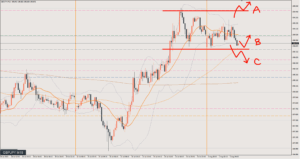
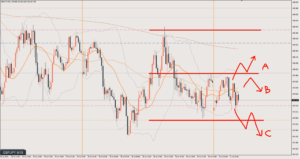
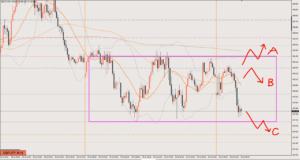
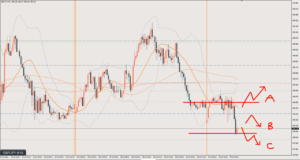
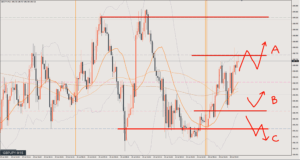
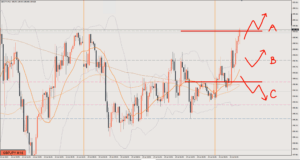
Scenario A
If price rises further from the current level, I’ll still wait for a pullback.
On the 15-minute chart, price has broken out of the range and a trend has started, but this goes against the higher timeframe, so there’s no need to rush into an entry.
I think it’s best to manage risk carefully and be selective about entry points.
Targets are hard to set based on the 1-hour chart (H1).
As a retracement of the recent drop, the pink line at 196.5 is the first target. Above that is the blue line at 196.9.
Scenario B
I see the current pullback candidate around the red line at 195.9.
If price pulls back to around there, I’d like to buy on a reversal on the lower timeframes.
If the pullback is deeper, I’ll keep a bullish bias down to around 195.7.
Targets are the same as Scenario A.
Scenario C
If price breaks below 195.7, my bias turns bearish.
Even in this case, I think an immediate sharp drop is unlikely for now.
Price has already dropped sharply once, so it needs to build up energy for the next leg down.
So I think the more likely pattern is that price forms a range on the 1-hour chart (H1) first and then drops.
In the current scenario, I’m picturing selling the rally from around 195.7, but I may need to rework the strategy depending on how the chart develops.
The target is also a bit hard to set, but for now it’s 195
Review

It played out as Scenario A.
Price rose further from where it was when I wrote the scenario in the morning, so I waited for a retracement back to the support/resistance (S/R) near B. It didn’t come back and went into a range instead, so I went long at the double bottom at circle ① after the decline stalled.
Price reached the 196.5 target and formed a double top on the 5-minute chart (M5), so I took profit there. 33 pips
After that, price dropped and made a bearish shift.
I went short at circle ②, the first retracement.
I wanted to hold this one to the blue line at 195, the Scenario C target, but with a data release coming up, I took profit just before it. 57 pips
This article reflects the author's personal view of the market. It does not recommend any specific trade; all investment decisions are your own responsibility.