2025/06/12 USD/JPY Trade Strategy

Today's USD/JPY call: Sell.
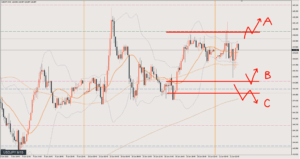
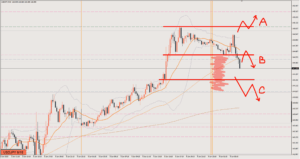
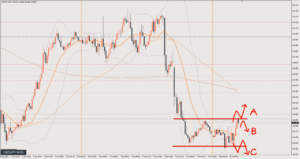
Price is sitting right at a key level price zone on the 4-hour chart, and the question is whether it breaks below.
The overall flow favors the downside, so today’s key point seems to be whether it breaks below from here, or pulls back up once more before dropping.
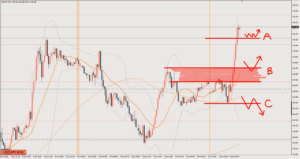
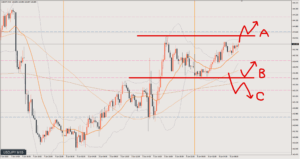
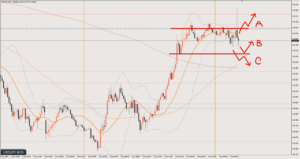
Scenario A
If price breaks above around 144.5, I’ll take that as a sign it’s heading higher again.
I’ll wait for a pullback after the break and look to go long.
Target is around 145
Scenario B
If it retraces a bit before falling, I’m watching the area from the pink line marked B at 144.2 up to where I’ve drawn the light red line as the guide for the retracement.
Target is 143.4 first, and 143 if it looks like it will drop further.
Scenario C
On the 15-minute chart (M15) it already looks like it has broken below slightly, but there’s a high chance that after breaking on the 1-hour chart (H1) level it will come back up to around this area once more, so I think going short from that timing is also fine.
Target is likewise around 143
Review

This was a sell under Scenario C.
The first entry point was ○1, where price made a retracement while forming lower lows.
I went short at the break below the blue 144 line, which acts as support/resistance (S/R) on the 4-hour chart.
Take profit at the touch of the first target, the 143.4 line. 52pips
After that, I waited for a retracement and could short again from ○2.
I was hoping for a drop to 143, but exited once a clear double bottom formed. 38pips
This article reflects the author's personal view of the market. It does not recommend any specific trade; all investment decisions are your own responsibility.