2025/06/09 USD/JPY Trade Strategy

The USD/JPY trade strategy for 2025/06/09 is to sell.
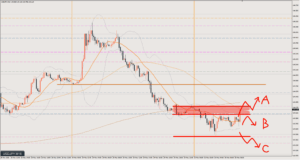
Until just a little while ago, I was looking to buy from Line B, but price has broken below it.
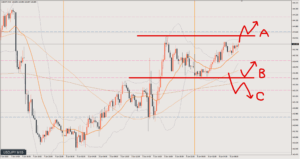
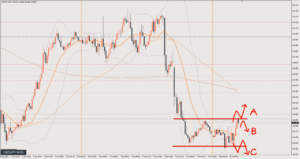
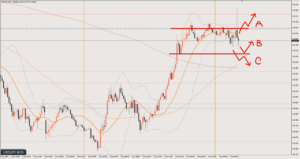
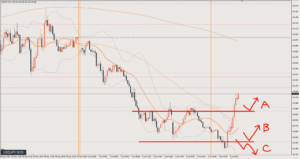
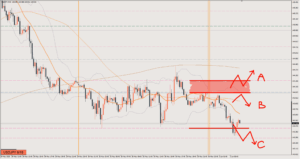
The price zone shaded in red is a zone where the view splits between selling and buying depending on which timeframe you use as your main one.
Based on the 15-minute chart, this is a spot to look for selling the rally.
However, until price breaks below the area around Line C, plenty of traders still have a bullish bias.
In short, it’s a tricky price zone.
With that in mind, my day-trading strategy based on the 15-minute chart is as follows.
Scenario A
If price breaks above the recent high, I’ll treat it as a buy and look for a pullback.
Since the rate has dropped quite a bit, there’s also a chance I’ll switch to a bullish bias sooner (at a lower price).
Target is around 146
Scenario B
Look to sell the rally.
As I mentioned at the start, this is a buy zone on the higher timeframes, so even if you go short, you need a plan such as exiting if price fails to make a new low on the 15-minute level.
Target is around 144
Scenario C
If price breaks below the area around 144, I’ll wait to sell the rally.
It’s questionable whether it will move this far in just one day.
Target is around 143.5
Review

It was a sell under Scenario B.
The retracement is a bit shallow, so you need to be careful, but you can enter at the point where it forms a small double top and drops.
Quick take profit once it reached the 144 target. 45 pips
That level could be the starting point of a rise on the 1-hour chart (H1), so there’s no reason to hold.
After that, it surged and made a bullish shift, but there was no place to enter.
This article reflects the author's personal view of the market. It does not recommend any specific trade; all investment decisions are your own responsibility.