2025/05/30 USD/JPY Trade Strategy

The USD/JPY trade strategy for 2025/05/30 is to sell.
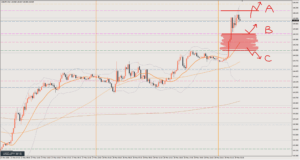
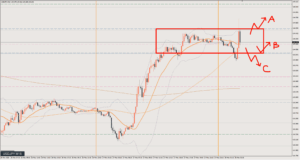
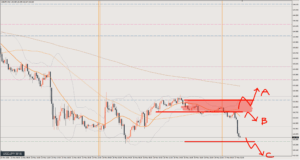
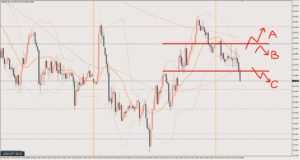
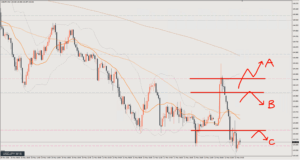
On the chart right now, price is in the process of breaking above Line B, but the zone from A to B is basically a sell zone.
In the short term it’s a buy, so I think jumping into a short too easily is risky.
This is a zone where you really need to read the price action carefully.
The overall flow is down, but a higher-low double bottom is forming, so there’s a good chance it could rise from here.
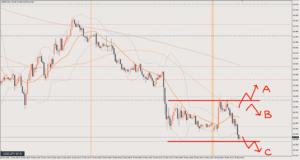
Scenario A
If price breaks above Line A at 144.2, I’ll see it as a buy and look to buy the dip.
Target is around 144.7.
Scenario B
If price can’t get above Line A, I’ll judge it as a sell.
I’ll enter once I spot signs of a drop, such as price turning down (making lower highs).
Target is around 143
Scenario C
Selling the rally after a break below.
Target is likewise around 143.
Review

There was no bullish shift, and price moved within a range all day.
Within that, the two red circles are places where you could go short.
The first red circle is slightly above the Scenario B line, but since price hasn’t broken above 144.2, I’m keeping a bearish bias.
However, right after the rise to around 144.2, I’d wait and see out of caution for a bullish shift and further upside, so the point where you can judge that price won’t go any higher is around the first red circle.
If you want to keep risk lower, the short from the second red circle is the safer option.
It’s selling the rally after a clear turning down (making lower highs).
Whichever one you enter, price stalls at the recent low, so that’s where you take profit. About 40–50 pips.
After that, price breaks above 144.2 at the blue circle, but I don’t see this as a bullish shift.
That said, in the short term the basis for selling has broken down, so it’s wait and see from here.
This article reflects the author's personal view of the market. It does not recommend any specific trade; all investment decisions are your own responsibility.