2025/05/23 USD/JPY Trade Strategy

The USD/JPY trade strategy for 2025/05/23 is to sell.
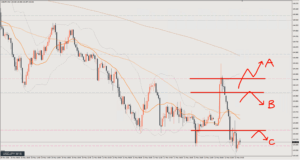
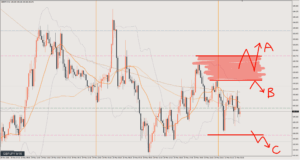
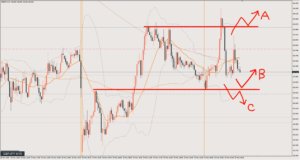
The chart has just broken below the C line, but before the break I was viewing it as a buy, just barely.
Now that it has broken below and the 15-minute chart (M15) candle is about to close, I see it as a sell.
From here I’m looking to sell the rally.
Yesterday printed a bullish candle on the daily chart, so if today is also bullish, a sharp rebound could come at some point.
I need to trade while keeping that kind of market context in mind.
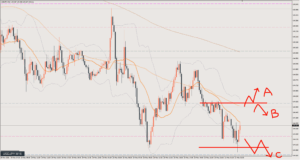
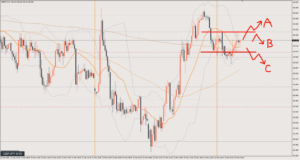
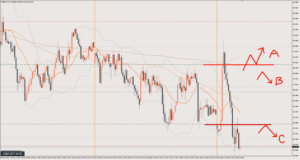
Scenario A
There is still room for upside on the 1-hour chart (H1) as well, so if price rebounds somewhere and breaks higher, I’ll treat it as a bullish shift.
However, the key level is the pink horizontal line at 144.2, just above the letter A.
The idea is to get in early on a short-term bullish shift, assuming price will go on to clear the pink line too.
Target is around 145.
Scenario B
Selling the rally after the current drop.
If price retraces back into the range, the risk-reward improves.
I’ll wait for an entry opportunity near the range high.
Target is around 143.3
Scenario C
Selling the rally at support/resistance (S/R).
It’s not a spot where I’ve drawn a horizontal line, but if price reacts at S/R, I’ll go short.
This is a setup where the trends on the 4-hour, 1-hour chart (H1) and 15-minute chart (M15) all line up.
Target is likewise around 143.3
Review

Early on, I was waiting for a retracement based on Scenario C, but price didn’t pull back much and dropped instead.
The next entry opportunity after that is a short from circle ①.
In terms of risk-reward, it’s just barely worth taking.
From there, it’s either take profit when price reaches the 143.3 target line, or hold in hopes of a further drop, accepting that it may end in a breakeven exit.
If you took profit, it was about 13 pips.
After that, when price made a new low and came back up, I was patiently waiting for a chance to get in short, but it dropped sharply, perhaps due to fundamentals or something.
In the middle of the sharp drop, you can enter short at circle ②, where there’s a brief S/R flip bounce on the 5-minute chart (M5).
You can’t get in unless you were watching the market with a “sell only” mindset before that point.
After that, take profit where it looked like the decline stalled at the round number of 142.5. 53 pips
This article reflects the author's personal view of the market. It does not recommend any specific trade; all investment decisions are your own responsibility.