2026/05/27 USD/JPY Trade Strategy

Today's USD/JPY call: Buy.
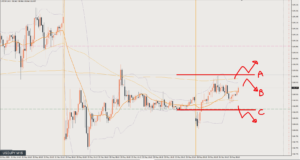
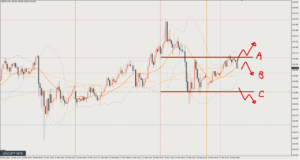
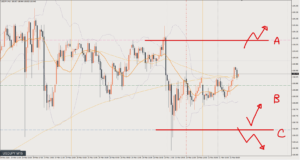
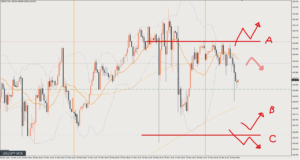
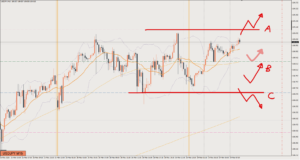
Technically, it’s a buy. Price is also starting to break above the 4-hour range.
Right now it’s pulling back in the short term, so this is the stage where we figure out where the pullback will form.
On the 15-minute chart it may have made a bearish shift, but the price zone marked in blue is the 4-hour range high, an area that should act as support.
A scenario where price finds support around here and starts rising again is also possible.
Review

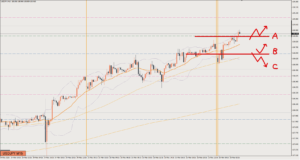
It played out as Scenario B.
It came right after I wrote the scenario, but I go long at circle ①, where price reversed on the 5-minute chart (M5).
Price then breaks out of the range, so I hold, but I take profit where it forms a double top at the next blue line up. 19 pips
Right after that it drops sharply, but as long as you weren’t being greedy, the timing was such that you wouldn’t have been caught in it.
Holding on the view that it would rise further is also a valid option.
The stop-loss level at entry is the pink line in the lower area of the image, so if you hadn’t moved your stop-loss level, I don’t think you would have been caught by the sharp drop.
That said, it is also rising in waves on the 1-hour chart, so with this shape there’s a good chance you would have moved your stop-loss level to just below circle ②.
This article reflects the author's personal view of the market. It does not recommend any specific trade; all investment decisions are your own responsibility.