2025/11/05 USD/JPY Trade Strategy

Today's USD/JPY call: Sell.
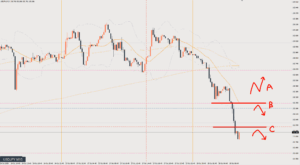
The area around the blue circle was a very clear entry point.
If you don’t have a position, this is a situation where you wait to sell the rally.
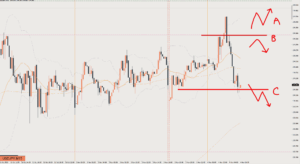
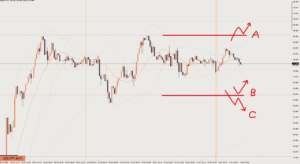
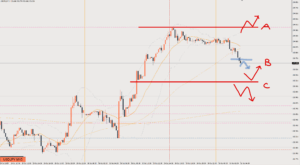
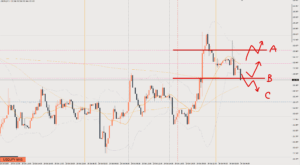
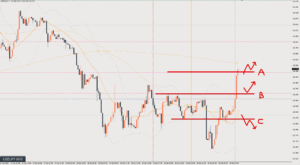
Scenario A
If price breaks above the green line around A, it turns into a range.
The 4-hour chart (H4) also looks set to break below with a candle body, so the chance of it getting above here may be low.
If it does break above, I’ll look for a short-term long, with a target of around 153.7
Scenario B
If price retraces back to around A and loses momentum, I’d like to sell.
The daily chart also suggests it still has room to fall.
Target is around 152.7
Scenario C
At this point, I can’t tell where it will bounce from.
If it falls further, I’ll need to rebuild my strategy.
If it gets stopped a few times at the pink line just above, maybe I can sell?
Target is likewise around 152.7
Review

Price moved up.
Trading in line with the 1-hour and 15-minute charts, there wasn’t really an easy place to get in.
The 4-hour uptrend just barely held, so if you keep viewing the 15-minute as an uptrend, you can start buying around the red circle.
This article reflects the author's personal view of the market. It does not recommend any specific trade; all investment decisions are your own responsibility.