2025/07/14 GBP/JPY Trade Strategy

Today's GBP/JPY call: Wait and see.
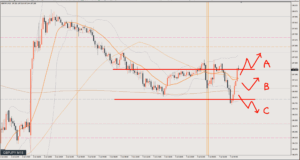
Both the 4-hour and 1-hour charts are ranging, so the picture isn’t clear.
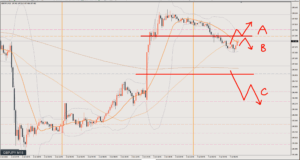
If I had to pick, it’s a buy, but price can’t get above the daily chart high.
And in the near term, for day trading, it’s a sell.
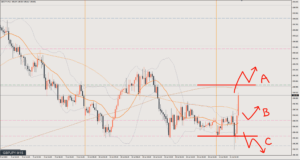
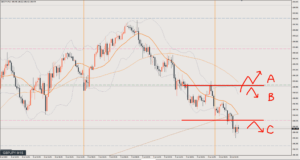
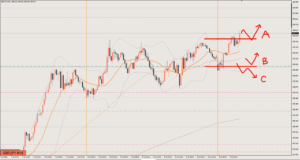
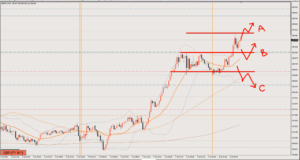
Scenario A
I see the resistance at the daily chart high as the green line at 199.
A break above here is a buy, but since it’s daily-level resistance, even if price pokes above it, it can easily turn into a false breakout and drop.
To avoid buying the top, time the entry carefully, and exit right away if it doesn’t work.
Target is 199.8
Scenario B
In the short term, it’s currently a sell.
It’s a range with no clear direction, so the strategy is to sell or buy from the top and bottom edges of the range.
So although I’ve written sell, going long on price turning up (making higher lows) from around the range low at 198.4 is also fine.
If selling, go short after seeing price turning down (making lower highs) from around the range high near 199.
Target is around the range low at 198.5
Scenario C
Looking to sell the rally after a break below the range.
In this case, I’ll look to sell the rally after a break below the blue line around 198.3.
Target is 197.6
Review

No trade.
From the evening onward, there was no real need to even look at the chart.
Looking closely, there were a few spots where you could have entered long, but with the daily chart resistance holding, it wasn’t a market context where I’d expect price to extend.
On days like this, it’s best to step away from the chart and take a break.
This article reflects the author's personal view of the market. It does not recommend any specific trade; all investment decisions are your own responsibility.