2025/06/09 GBP/JPY Trade Strategy

The GBP/JPY trade strategy for 2025/06/09 is to buy.
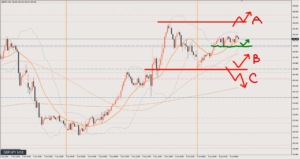
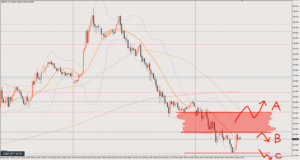
Right now there are hardly any bearish factors on any timeframe, but the weekly chart, daily chart and 4-hour chart are all in a resistance zone, so watch out for the price being capped and reversing lower.
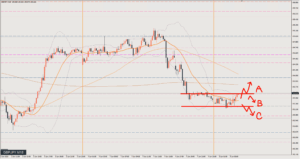
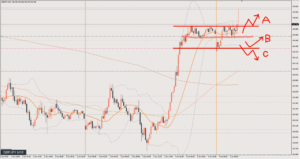
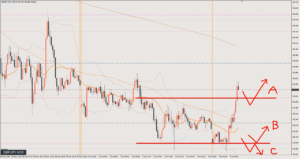
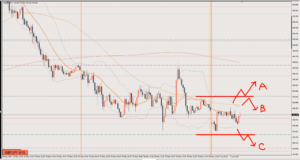
With that market situation as the premise, I’m considering the following three scenarios.
Scenario A
Entering with this pattern may be the one that calls for the most caution.
I’ll aim for the pullback after a break to the upside, but I’ll need to respond flexibly.
I see the target around 196.8, but I feel there’s no need to rush into a trade until the price clearly breaks above the 196.4 area.
It’s not too late to join after the break to the upside on the 4-hour level.
Scenario B
A long from the range low.
I’m also keeping in mind a bounce from the line near the letter B, without the price falling all the way to the low.
If it does drop to the low, I’ll wait for an entry opportunity while being careful not to end up countertrend trading in the short term.
Target around 196.4
Scenario C
The pattern where the price fails to break the resistance and comes down.
I’ll aim to sell the rally after the price breaks below the current range.
Target around 195.1
Review

On the bigger picture, it was a range day.
The first opportunity was the long from the red circle.
This is where the 1-hour role reversal comes in, and if you look closely at the 5-minute chart (M5), there’s a point where price bounces off the line and starts turning up (making higher lows).
That’s the best entry point.
After that, price didn’t fully rally, and exiting where it made lower highs and looked like it might drop is also a valid option. 25 pips
That said, the entry rationale hadn’t broken down, so holding is fine too.
It’s a judgment call, weighing the fact that every timeframe from the daily chart down is a buy against the fact that this is a daily resistance zone.
If you hold, since it’s late at night, assume you’ll carry it overnight, put your stop-loss level around a break of the 195.7 line, and just leave it.
However, I didn’t clearly write this trade into the morning scenario, so it’s not counted.
The bullish bias stays in place until price breaks below the light red line on the morning chart, but my explanation was insufficient.
If you missed ○1, you could also enter at ○2, the pullback after the rally.
Take profit here the same way as ○1. 13 pips+
If you’re aiming for a short-term trade, the blue circle is a possible short.
This article reflects the author's personal view of the market. It does not recommend any specific trade; all investment decisions are your own responsibility.