2025/03/27 GBP/JPY Trade Strategy

GBP/JPY trade strategy for 2025/03/27
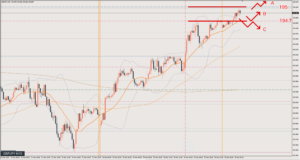
At a glance, I have a feeling this will be a “tricky” day.
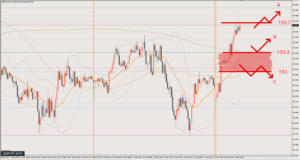
From a day trading perspective, the near-term bias is to sell.
However, both the daily chart and the 4-hour chart have a bullish bias, so it feels tricky.
On days like this, I think it’s fine not to force a trade and just leave it until a clear direction emerges.
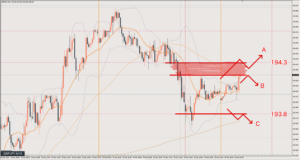
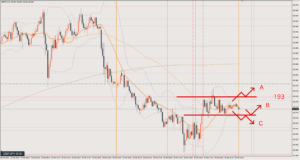
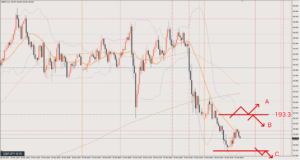
Scenario A
Buying the dip after price breaks above the high around 194 and the flow turns bullish.
In this case, there is a good chance a double bottom will have formed on the 1-hour chart (H1) as well, and conditions may be in place for a rise.
Target is around 194.4. Depending on the situation, I’d like to extend it to around 194.7.
Scenario B
If price fails to break above around 194 and starts turning down (making lower highs), I’ll look for a short.
Be careful: given the current chart shape, you can’t sell just because price reaches around 194.
I think it will need a bit more time.
Target is around 193.3.
Scenario C
Selling the rally once the downtrend becomes clearer.
I’m assuming the retracement could reach around the pink line at 193.8, and I’ll judge based on the actual price action.
Target is the same as Scenario B.
Review

It played out as Scenario A.
I thought price would drift around in the range a bit longer, but it rallied surprisingly smoothly.
The best trade was buying the dip at ○1 after the bias aligned with the higher timeframe.
Taking profit at 194.4 (35 pips) here is fine, but the market context was good and the 20 MA was supporting price nicely, so holding was OK too.
If you held, momentum showed no sign of fading at the 194.7 target, so you could let it run further.
The best take profit was where price stalled at the blue line above. 90 pips
If you took profit at 194.4, the next pullback at ○2 is theoretically the same setup as Scenario A, so you can enter.
However, looking at the actual chart, it becomes something like countertrend trading on the lower timeframe, so it’s a spot where you’d hesitate to enter.
After that, it’s late at night, but ○3 is also a long opportunity.
This is where price forms a higher-low double bottom on the 5-minute chart (M5) and rises.
Take profit once it reaches the line above and momentum fades. 60 pips
This article reflects the author's personal view of the market. It does not recommend any specific trade; all investment decisions are your own responsibility.