2025/03/26 GBP/JPY Trade Strategy

GBP/JPY trade strategy for 2025/03/26
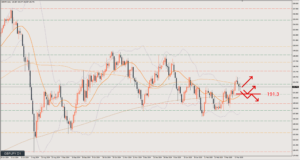
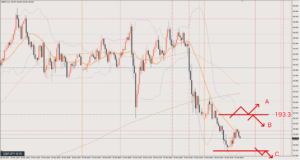
Near term, it’s a sell. This is the time to judge the retracement on the 1-hour chart.
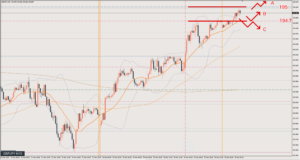
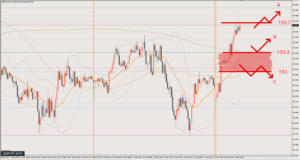
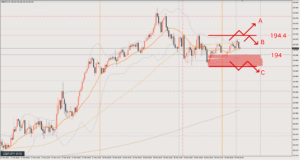
However, both the daily chart and the 4-hour chart are rising, and the 4-hour in particular is sitting right where a pullback would fit nicely.
I’ll be watching for entry timing while keeping in mind the pattern where price turns higher from here.
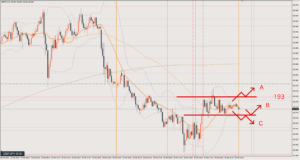
Scenario A
The pattern where I switch to a bullish bias and aim for a pullback.
If price breaks above around 194.3, I think a bullish bias is fine.
However, it’s better to treat the area above the price currently acting as resistance as a zone.
It looks like I’ll need to carefully judge where the pullback forms.
I’d like to target around 195, but if it loses momentum around 194.7, I’ll take profit.
Scenario B
The pattern where price fails to break the resistance and falls.
In this case too, I think it could rise into the zone once before dropping.
For a short entry, I’ll sell the rally after seeing lower highs.
Target around 193.8.
Scenario C
If it breaks below 193.8, from a day trading perspective the flow is fully bearish.
Depending on the chart at that point, I’ll need to judge where the retracement will be.
Around 193.8 or 194 are the candidates.
The target will be around 193.3.
Review

Scenario A played out.
However, once price clearly broke above 194.3, there was no pullback.
If you were watching the lower timeframe and saw it forming an upward wave in the move just before that, there was a place to get in.
In the background, the market context analysis also suggested that the 4-hour chart (H4) was forming a pullback and likely to rise.
Take profit was at the line around 194.7.
I closed the position when it formed a double top and started losing momentum. 45 pips
After that, there were no opportunities, so I waited and saw.
This article reflects the author's personal view of the market. It does not recommend any specific trade; all investment decisions are your own responsibility.