2025/03/28 GBP/JPY Trade Strategy

GBP/JPY trade strategy for 2025/03/28
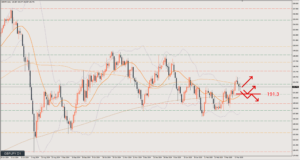
The overall flow is firmly to the upside.
However, on the daily chart, this could turn out to be a high for now, with price forming a pullback.
With that in mind, today’s strategy is as follows.
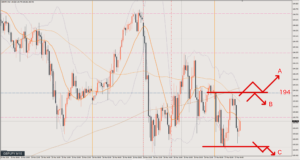
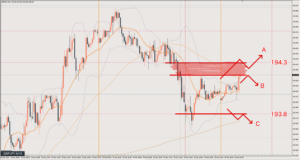
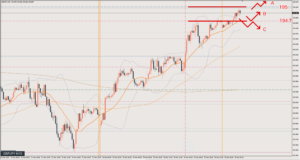
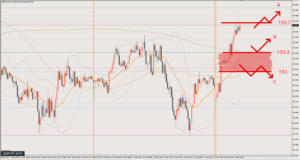
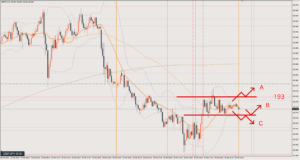
Scenario A
The pattern where the rise continues.
Enter while watching out for false breakouts.
The target is probably around 195.5.
Scenario B
For Scenario B, the shape is already almost at the point where an entry would be fine.
I just need one more step of structure to form on the lower timeframe.
That said, even if price breaks the current level, the area down to about 194.8 looks likely to act as a support zone.
Be careful with entry timing and the stop-loss level.
Also, since the daily chart’s rise may stall, take profit immediately if it looks like price can’t break 195.9.
Scenario C
The pattern where the daily chart loses momentum and price moves to form a pullback for now.
A bearish bias would be fine once price breaks below Scenario B’s 195.3, but the blue line around 195 will be fairly strong support.
If you treat the area down to about 194.8 below that as a support zone, the win rate and risk-reward are questionable.
So for Scenario C, the plan is to target a retracement after price clearly breaks the blue line.
The target is around 194.3
Review

In the end, it went down.
For Scenario B, I wrote “if a setup forms on the lower timeframe with just one more step,” but that “setup” never formed and price kept falling.
If anyone went long on Scenario B, you need to review it carefully.
Why was it still too early to go long?
The first entry point was ○1.
As I wrote in Scenario C, this was the retracement after the break below the blue line.
This was a relatively easy setup to enter, and the downside stalled at the pink line at the bottom of the zone. 40 pips
The next chance was ○2, a short from where price retraced back to around 195.3 once more.
This one is a bit harder to enter, but the 1-hour chart was clearly turning into a downtrend, and this is a spot that becomes clean support/resistance.
Take profit is around the pink line near 194.3, at the point where a small double bottom looks likely to form. 80 pips
○3 requires quick reflexes, but it’s clean support/resistance, so you can enter.
However, it’s also a spot where you need to watch out for a bounce from around 195.3, so you enter cautiously with that in mind.
If you entered, take profit around the blue line at 194 when it looks like a double bottom is forming. 55 pips
This article reflects the author's personal view of the market. It does not recommend any specific trade; all investment decisions are your own responsibility.