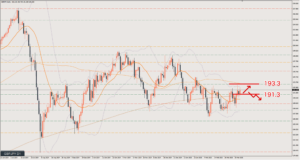
2025/03/17 GBP/JPY Trade Strategy

Near term, I’m a buyer. However, this price zone is a recent high on the higher timeframe, so I need to watch out for a sharp drop.
This morning’s strategy is as follows.
Scenario A
Buying the dip after a break to the upside. If price moves above around 192.45, the scenario will need to be updated.
If buying, I need to watch out for a sharp drop from the highs.
My stance is to get out right away if it looks like it’s going to fall.
Target is around 193.
Scenario B
A pattern where price doesn’t rise smoothly but ranges for a while before moving up.
In this case, I’d like to wait for a long from around 192, but I need to watch the lower timeframe closely and enter carefully.
If price comes down without Scenario A playing out, the chances of a lower-highs double top on the 1-hour chart (H1) followed by a drop also increase.
Scenario C
Downside pattern.
If I enter on this pattern, I expect it will already be the European session by then.
I’ll be looking to sell the rally after a clear break below the 192 line.
Target is around 191.7.
It depends on how the chart develops, but there isn’t much room to run.
Review

In the end, price went up.
There were about three places where you could have entered.
○1 is a long on the pullback after the rise, following Scenario A from the morning strategy.
After this, price doesn’t make a new high and comes back down to the line, so it’s a position where you’d be torn about whether to hold.
If you didn’t get in at ○1, ○2 is the entry opportunity.
This assumes that price has been supported at the 192.45 line for a long time and won’t go any lower.
You enter when you see higher lows on the lower timeframe.
However, there’s a US data release at 9:30 pm JST (12:30 UTC).
Whether you could realistically enter here is a tough call.
Technically, it’s a valid entry.
After that comes ○3, which is an easy place to get in.
This is where the rise on the data release settles down, and price forms a clean pullback on the 1-hour chart (H1) before rising.
Since it’s late at night, there’s the question of how long you’ll keep watching the chart.
If you want to play it safe, setting a limit near the green line at 193.3, the recent high, is fine.
That’s because, at the time of entry, the market context doesn’t justify saying price will keep rising from here.
If you’ll be watching the chart until around 3 am JST (18:00 UTC the previous day), setting a limit near the pink line around 193.8 is also OK.
This article reflects the author's personal view of the market. It does not recommend any specific trade; all investment decisions are your own responsibility.