2025/07/23 GBP/JPY Trade Strategy

Today GBP/JPY is a buy in the near term.
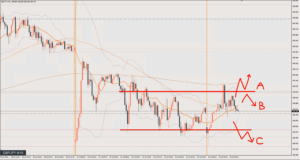
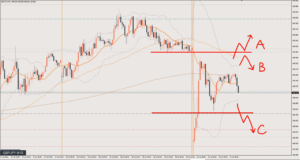
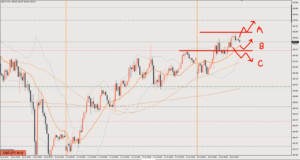
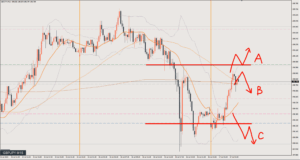
The daily chart is rising, the 4-hour chart is falling(?), and the 1-hour chart is falling.
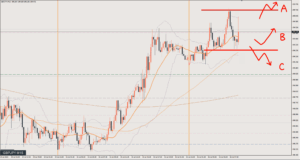
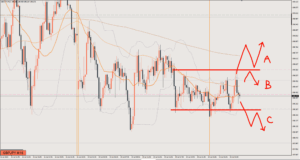
It’s a buy in the short term, but I expect the price to fail to break above the blue circle area and then drop.
Scenario A
If the price breaks above the green line at 199, there’s no longer any reason to sell.
I’ll look for buying the dip.
Target is 199.8
Scenario B
For now, it’s a buy for day trading.
If the price bounces from the price zone between around the pink line at 198.6 and 198.3, I’ll buy.
However, since I expect it to fail to break above 199, I’ll exit as soon as the move stalls.
Scenario C
If the price keeps falling from here, it’s hard to decide where to look for a sell.
Scenario C assumes the price heads higher once more, fails to make a new high, and then drops.
So the entry point may change depending on how the chart shapes up.
Target is 197.6
Review

It was Scenario B.
Right after I put together the morning scenario, I went long when price bounced without breaking the pink line.
I took profit when bearish candles started to appear as price reached the green line at 199. 30 pips
After that, there was no setup I felt like trading, so I waited and saw and called it a day.
This article reflects the author's personal view of the market. It does not recommend any specific trade; all investment decisions are your own responsibility.