2025/04/10 GBP/JPY Trade Strategy

The GBP/JPY trade strategy for 2025/04/10 is to buy.
It dropped yesterday, but as expected, being near a key level on the weekly chart, it bounced back sharply.
Right now it’s in a somewhat tricky spot.
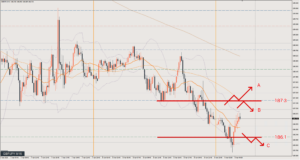
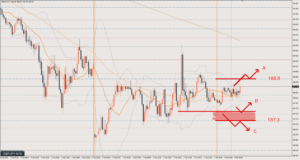
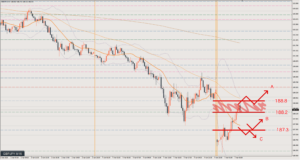
The daily chart is pointing down, the 4-hour is unclear, and the 1-hour is pointing up.
With that in mind, here’s how I see near-term day trading.
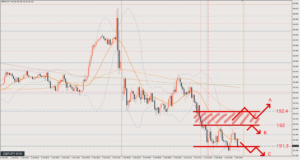
Scenario A
This is the upside pattern, but it’s hard to see an immediate breakout from the current state, so I think it’ll take a little time.
Think of it as the second option if you miss the entry in Scenario B.
The target could be as far as around 192.
Scenario B
Go long on a bounce from around the current price zone.
Highs are still turning down (making lower highs) right now, so watch carefully whether it holds at the current price zone before entering.
Scenario C
If it breaks below the current price, I think it will drop one more leg.
This scenario aims to take a short piece of the drop down to the 1-hour pullback.
Target around 187.3
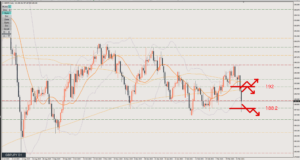
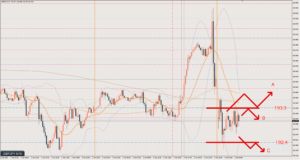
Review

Early on, you can buy at ○1 under Scenario B.
The green line was being respected, and this is a long from where price made a small higher low.
Price does rise after that, but it drops right after reaching the recent high on the 15-minute chart.
If you were aware of the 4-hour chart (H4) context, you could picture a drop from a double top, so take profit where the rise stalls.
Even so, you can still get around 70 pips.
Since price didn’t reach the upper red line, if you held, you’d end up with a breakeven exit on the subsequent drop.
After that, highs turned down (making lower highs), and once price also broke the green line, you could sell the rally somewhere around ○2.
Price didn’t drop right away here, and if anything you can see higher lows forming, so exiting once is fine too.
There was also a data release coming up at 9:30 pm JST (12:30 UTC).
For trading around data releases, please refer to the article below.

I think ○3, after things settled down without the data release causing any major turbulence, is the best entry point of the day.
Taking profit when price reached the 187.3 line, which was the target in Scenario C, is fine too (60 pips).
However, it broke below in one go, so if you’re watching the chart, you hold.
Then take profit when you see price suddenly bounce back after dropping further.
I didn’t draw a line there, but it’s a price that acts as support/resistance (S/R) on the 1-hour chart. 100pips
This article reflects the author's personal view of the market. It does not recommend any specific trade; all investment decisions are your own responsibility.