2026/04/02 USD/JPY Trade Strategy

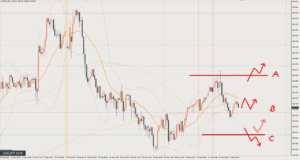
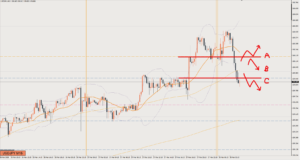
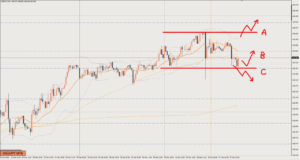
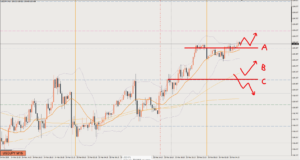
Today's USD/JPY call: Sell.
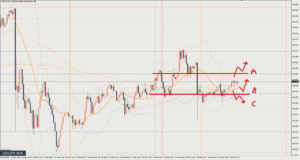
The 4-hour chart (H4) and lower timeframes look like sells.
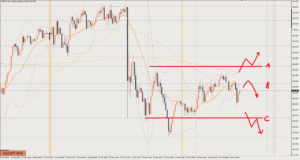
However, on the daily chart, price is at a spot where it could start rising from around here.
If it breaks above Line A, I’d see that as a bullish shift and look to go long.
If it keeps turning down (making lower highs), the strategy is to simply sell.
Review

No trade.
I was looking to sell early on, so there was no opportunity to enter.
In cases like this, it’s fine to accept it as “a rally I couldn’t catch” and wait for the next chance.
It’s outside the plan, but the red circle is a spot where you could go for a long.
Price broke above the pink line at 159.3, which I had originally considered a buy target, and is now being supported by that pink line instead. That’s how I see it.
This article reflects the author's personal view of the market. It does not recommend any specific trade; all investment decisions are your own responsibility.