2026/03/06 GBP/JPY Trade Strategy

Today's GBP/JPY call: Buy.
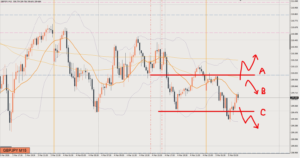
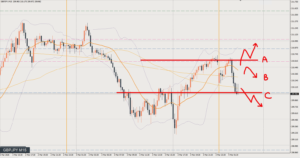
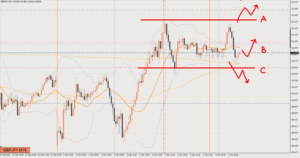
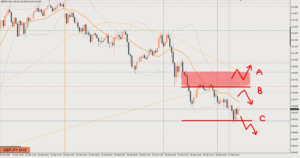
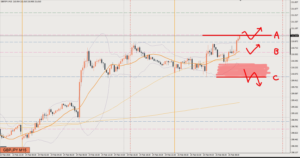
Price has broken above the range from up to yesterday, so I have a bullish bias.
The daily chart is also turning up with higher lows and is starting to look like it wants to rise.
I can picture it rising from here into next week, but at the day-trading level it’s not smart to buy from a spot where the stop-loss level ends up far away, so I want to patiently wait for a pullback and buy that.
If it breaks higher, I might just have to follow it?
Review

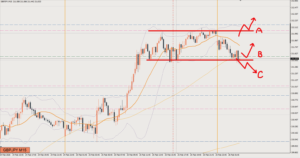
It was Scenario B.
Long at circle ①, the first pullback after the drop from Line A.
However, since this has made a bearish shift on the short term, you could expect the rise to stall around 210.75.
With that in mind, I take profit as soon as a bearish candle appears on the 5-minute chart (M5). 13 pips
I don’t write about it much on the blog, but these kinds of small skimming trades are a way to earn profit beyond the main target.
After that, price breaks the low once, so under Scenario C I go short at circle ② on the retracement.
This is also a position taken on the assumption that price won’t keep falling, since the overall flow is to the buy side and the daily chart is starting to take a shape that looks set to rise.
Price stops falling around the recent low, so I take profit there. 18 pips
After that, long at circle ③, where price stops falling again and looks like it’s firming up a low.
Price drops without making a new high, so you either exit around breakeven or hold until it breaks the low near the circle ② take profit.
If you go long from circle ③, the stop-loss level is set below the lower blue line, so I think holding is fine too.
You can aim for another long from the higher lows at circle ④.
If you held a long from circle ③ or ④, you could take profit when price reached the 211.5 target around dawn. About 85 pips
On this day, the big-picture flow was to the buy side, and both the weekly chart and daily chart looked set to close higher. If you had that picture in mind, I think you could hold a bias of buying from support/resistance (S/R) and higher lows.
This article reflects the author's personal view of the market. It does not recommend any specific trade; all investment decisions are your own responsibility.