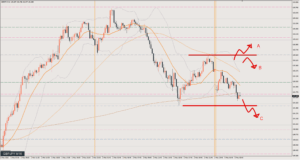
2025 Week 20 GBP/JPY Weekly Strategy

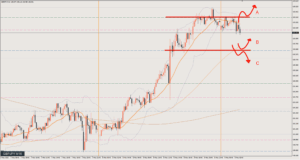
Last week, price made a big pullback and then started rising again.
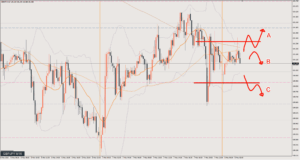
On Friday it also formed a small pullback on the 4-hour chart (H4) and rose, so it looks like it could break out to the upside from here.
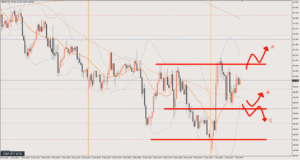
If it doesn’t rise smoothly, I think it may range between 190.3 and 193.3.
For example, it could make a pullback to around the green line at 192 and then climb while turning up (making higher lows).
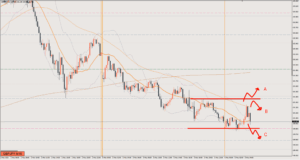
As a selling factor, the weekly chart is still turning down (making lower highs), but since it closed with a fairly strong bullish candle, it might keep rising this week too.
In that case, I think the weekly chart’s recent high of 195.8 will come into view.
This article reflects the author's personal view of the market. It does not recommend any specific trade; all investment decisions are your own responsibility.