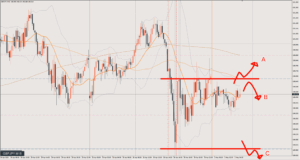
2025/05/08 GBP/JPY Trade Strategy

The GBP/JPY trade strategy for 2025/05/08 is: buy
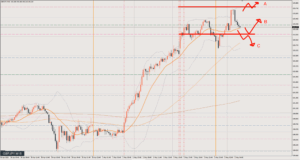
Yesterday closed as a bullish candle on the daily chart, so if the uptrend continues, maybe today will be a bullish candle too.
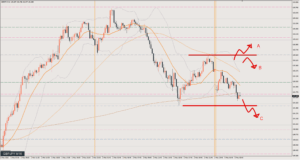
The 4-hour chart (H4) has also come down to a good price, so it feels like it might be about time to start buying.
However, for now I see the 15-minute chart as heading down.
I’ll consider an entry after seeing higher highs and higher lows on the 15-minute level.
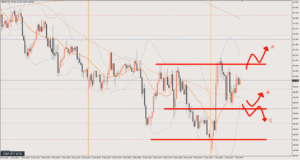
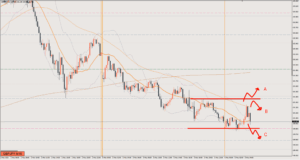
Scenario A
Buying the dip after price breaks above the recent high.
Target is around 192.
Scenario B
Technically this is a sell, and price has already formed what looks like a double top.
But if you ask whether the 1-hour chart (H1) is a sell, it feels like it’s just barely holding at the pullback low.
If anything, the situation leans toward buying.
So Scenario B, the sell, is not a strategy I’ll actively take.
Scenario C
If price breaks below this area, the 1-hour chart (H1) can also be seen as a sell.
I’ll look to sell the rally after the break.
Target is around 190.3, but watch out for a bounce off the blue line at 190.7.
Review

It was a buy-only day.
The best trade was the buy from circle ①.
I didn’t write this in the morning scenario, but the logic is that if Scenario B’s drop doesn’t happen, the price goes up.
In a market context where a rise was highly likely, I’d enter based on two things: the 1-hour chart (H1) was shaping up nicely as a pullback, and just before circle ① the price printed a lower wick and was turning up (making higher lows) on the 5-minute chart (M5).
If you missed circle ①, there’s circle ②.
This falls under Scenario A: a long at the point where, after breaking higher, the price didn’t pull back much and kept turning up and rising.
For both circle ① and circle ②, take profit around 192.4. When the rise stalled around 7:30 pm JST (10:30 UTC), take profit without hesitation. 115 pips, 65 pips
The reasons are that the UK interest rate decision was due at 8 pm JST (11:00 UTC), and that, although there was no horizontal level there, the price had reached a point that could be seen as the end of the rise based on the waves on the 4-hour chart (H4).
After the data release, you could buy at circle ③.
There were no sell factors, so this was a spot where buying was the only option.
Take profit when the price reaches the green line at 193.3.
This is a key level on the daily chart, so it won’t be broken easily, and since it’s late at night, there’s not much benefit in holding. 54 pips
This article reflects the author's personal view of the market. It does not recommend any specific trade; all investment decisions are your own responsibility.