2026/07/17 GBP/JPY Trade Strategy
Today's GBP/JPY call: Sell.

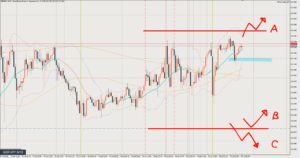
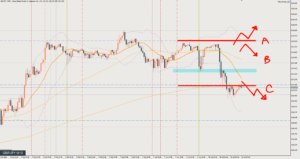
There are no signs of a rise yet, but the question is how to read the brief break above Line A around 10 am JST (01:00 UTC).
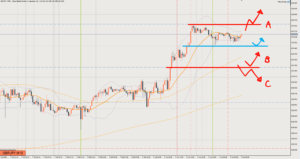
Looking at the upward wave on the 1-hour chart (H1), Line B is a price level that traders will be watching as a Fibonacci level.
From these perspectives, we need to keep in mind that the price might start rising from around here.
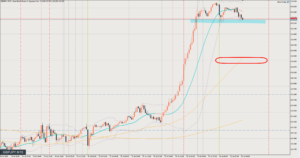
However, looking at the wave on the 4-hour chart (H4), the pullback is a bit shallow.
If it drops one more leg, the blue line at 217.8–9 is an ideal pullback candidate.
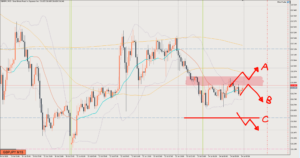
Ultimately I want to buy, so the plan is to watch where the decline stops, but if the price breaks below Line B, it’s fine to go for a quick short.
Review

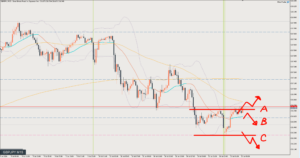
It was Scenario C.
Short at ○1, where the retracement after breaking below Line C formed lower highs.
Take profit is where price forms a double bottom at the round number just short of the target line. 52 pips
This is the price I had written as a “rough guide for now” in yesterday morning’s scenario.
This article reflects the author's personal view of the market. It does not recommend any specific trade; all investment decisions are your own responsibility.