2026/07/10 GBP/JPY Trade Strategy

Today's GBP/JPY call: Sell.
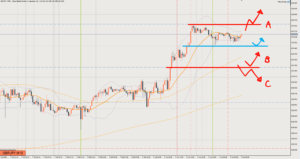
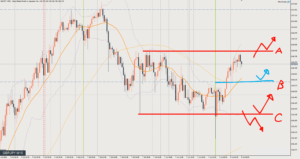
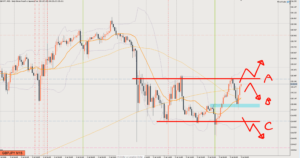
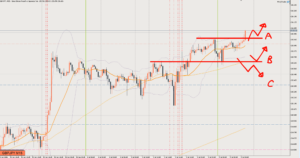
The 1-hour chart (H1) has made a bearish shift, and on the 15-minute chart (M15) we’re waiting for a retracement.
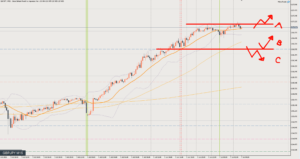
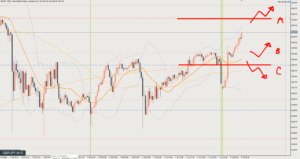
However, the daily chart and the 4-hour chart (H4) are still in an uptrend, so we need to stay alert for upside until price breaks well below Line C.
With that kind of move in mind, I want to wait for a spot where I can enter on the 15-minute level.
The area around the blue marker is one possible retracement target, but if price rises from the current shape, dip buyers on the 4-hour chart (H4) may step in, so treating C as a pullback and buying is also a valid bias here.
In a situation like this, price can whipsaw within a range, so be careful whether you’re selling or buying.
Review

It was Scenario C.
A short from ○1, the retracement after breaking below Line C.
Price bounces back from a half-hearted level here, but since it’s in the low zone on the 4-hour chart (H4), I take profit early. 30 pips
After that, price rises back above Line C once, but quickly drops again.
Another short from ○2, an S/R flip bounce on the 5-minute chart (M5), with a Scenario C bias again.
Since it’s late Friday night, I take profit when the target is reached. 50 pips
If you only look at the 15-minute chart (M15), you might hesitate to sell because of the rise just before ○2, but on the 1-hour chart (H1) it’s a clean point for selling the rally.
A small double top formed on the 15-minute chart (M15) right at the neckline of the double top that had been forming on the 1-hour chart (H1), and the 20 MA is also pressing down from above.
This article reflects the author's personal view of the market. It does not recommend any specific trade; all investment decisions are your own responsibility.