2026/07/03 GBP/JPY Trade Strategy

Today's GBP/JPY call: Sell.
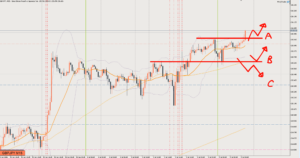
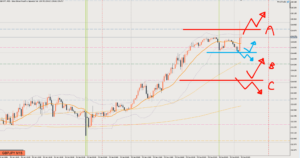
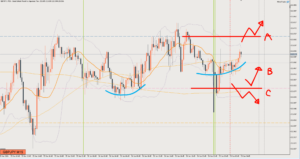
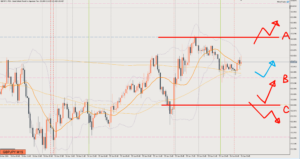
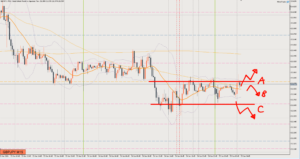
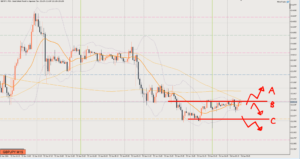
On the 1-hour chart (H1) I have a bearish bias, and price is currently ranging between A and C.
Line C is support on the 4-hour chart (H4), while Line A is where selling the rally comes in.
In short, price is caught in between, which makes this a tricky spot.
In the near term, the 15-minute chart (M15) is rising from the support/resistance (S/R) marked in blue, but if it gets stopped at Line A and starts turning down (making lower highs), I’d like to sell.
Note that the daily chart is rising, so this isn’t an environment for a big drop.
Review

It was a range.
It was a borderline situation where price may or may not have broken above Line A, but since it hasn’t broken the recent high, my bias is still to sell.
I went short at ○1, where the 5-minute chart (M5) turned into a downtrend.
Price was stopped at the range low and bounced back, so I exited. 25pips
This article reflects the author's personal view of the market. It does not recommend any specific trade; all investment decisions are your own responsibility.