2026/06/04 GBP/JPY Trade Strategy

Today's GBP/JPY call: Sell.
Following on from yesterday’s move, the near-term bias is to sell.
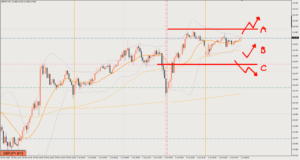
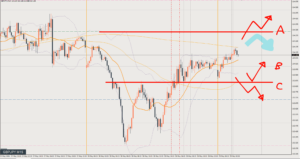
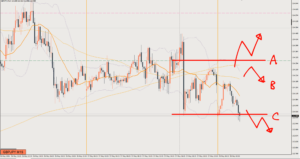
However, the blue line is the 4-hour pullback low, and it’s a price zone that has been acting as support/resistance (S/R).
Strictly speaking, price is below the blue line, but on the 4-hour level it’s still too early to tell.
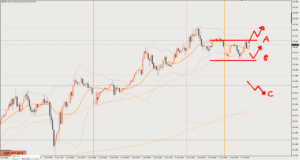
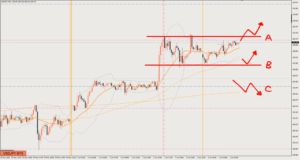
Sellers have the upper hand in the near term, but the strategy is to sell only after Line C breaks, and to switch to buying if price gets above Line A. Within the current range, it’s best to wait and see.
Review

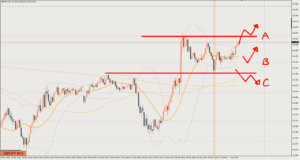
It was Scenario A.
In the end, price just barely held the 4-hour chart (H4) support and rose.
After two false breakouts to the downside, it turned higher.
By the time it broke above Line A, the 15-minute chart (M15) had also made a bullish shift, so you could go long from circle ①, a pullback on the 5-minute chart (M5) level.
Take profit where the rise stalls. 27pips
This rise is the “first wave” on the 1-hour chart (H1), so the assumption is that price will come down once more.
This article reflects the author's personal view of the market. It does not recommend any specific trade; all investment decisions are your own responsibility.