2026/05/29 GBP/JPY Trade Strategy

Today's GBP/JPY call: Buy.
In the near term, I’m looking to buy for day trading, but the market context is tricky.
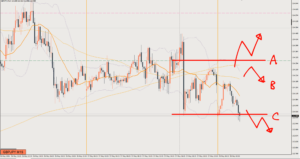
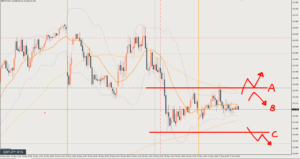
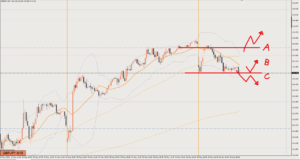
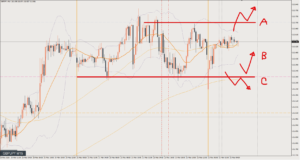
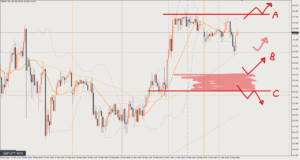
The 1-hour chart (H1) has broken above the neckline of a double bottom, which is a buy, but on the 4-hour chart (H4) this is a retracement in the middle of a decline.
The daily chart is unclear, but if anything, my impression is that buyers have the edge.
If price breaks above Line A, the selling pressure on the 4-hour chart (H4) will also weaken, so waiting until then is also a valid strategy.
Review

A drop, then a rise.
Price moved exactly as the market context suggested.
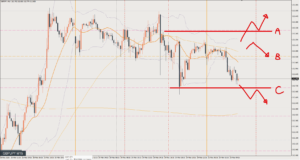
In the first half, it formed a double top, the rise stalled, and it dropped in line with the 4-hour chart (H4) flow.
It didn’t reach the recent low, made higher lows, and then rose again…
It was a day where your trade depended on which timeframe you treated as your main one, but if you were working with a 4-hour chart (H4) bias, you could have shorted around the blue circle.
In the scenarios, this is Scenario C, with a short from circle ①.
This one stopped falling partway through, so it’s an exit. 18 pips
The rise after that is not really one you could have caught.
This article reflects the author's personal view of the market. It does not recommend any specific trade; all investment decisions are your own responsibility.